> ## Documentation Index
> Fetch the complete documentation index at: https://algolia.com/llms.txt
> Use this file to discover all available pages before exploring further.
# Recommend analytics
export const Application = () =>
application
;
export const AlgoliaRecommend = () => ;
Recommend analytics offer insights into how your users interact with your recommendations,
through [metrics](/doc/guides/algolia-recommend/analytics/metrics) such as popular recommendations, click-through and conversion rates.
If you are familiar with [Search analytics](/doc/guides/search-analytics/overview), you will find that many of the concepts and metrics are similar.
## Recommend analytics in the Algolia dashboard
You can access your Recommend analytics in the Algolia dashboard:
1. Go to the [Algolia dashboard](https://dashboard.algolia.com/explorer/browse) and select your Algolia .
2. On the left sidebar, select **Recommend** and go to [**Analytics**](https://dashboard.algolia.com/recommend/analytics).
3. If you want to [segment the analytics by tags](/doc/guides/search-analytics/guides/segments),
click **Toggle Analytics Tags**.
Select or enter a tag for filtering.
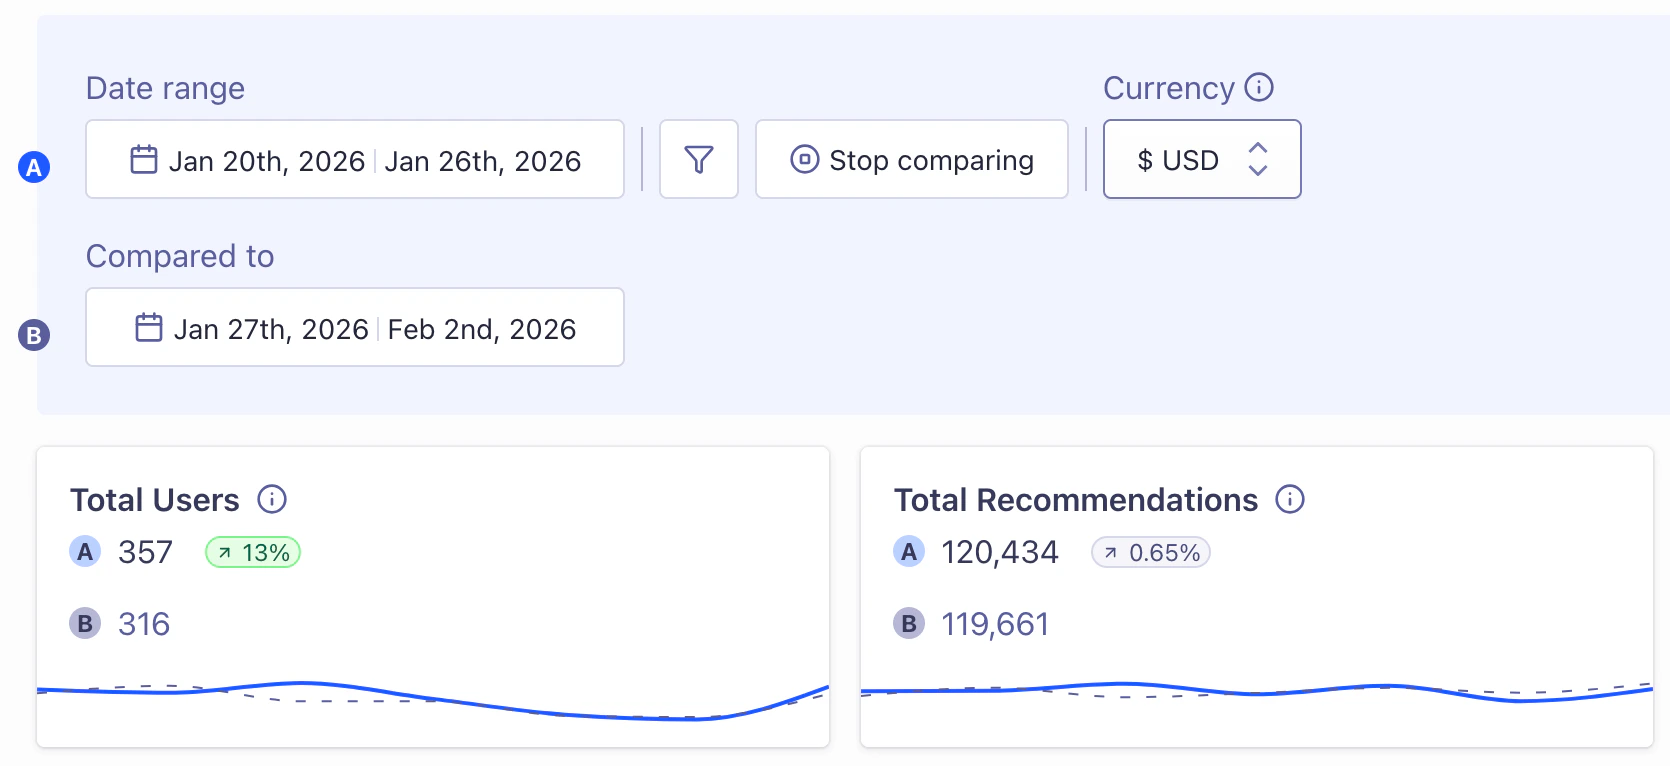
### Comparison mode
To compare the performance of your [metrics](/doc/guides/algolia-recommend/analytics/metrics) between different periods,
click **Comparison mode** and select the date ranges you want to compare.
The current date range is labeled **A** in the metrics graphs and uses a solid line.
The comparison date range is labeled with **B** and uses dashes.
You can compare analytics from different days, weeks, months, or use custom time ranges.
You can also compare analytics data using different [analytics tags](/doc/guides/search-analytics/guides/segments).
### Export analytics data
To export any of the [metrics](/doc/guides/algolia-recommend/analytics/metrics) from the Algolia dashboard,
click **Download**.
You can export and download your analytics data as CSV or XLSX files.
## Click, conversion, and revenue analytics
Some [metrics](/doc/guides/algolia-recommend/analytics/metrics),
such as the conversion rate, need [events](/doc/guides/sending-events) from your app or website.
Graphs and tables that involve these metrics won't display data until you start sending events.
Add-to-cart and purchase metrics are part of the Revenue Analytics feature.
This feature isn't available on every plan.
Refer to your [pricing plan](https://www.algolia.com/pricing) to see if it's included.
 The current date range is labeled **A** in the metrics graphs and uses a solid line.
The comparison date range is labeled with **B** and uses dashes.
You can compare analytics from different days, weeks, months, or use custom time ranges.
You can also compare analytics data using different [analytics tags](/doc/guides/search-analytics/guides/segments).
### Export analytics data
To export any of the [metrics](/doc/guides/algolia-recommend/analytics/metrics) from the Algolia dashboard,
click
The current date range is labeled **A** in the metrics graphs and uses a solid line.
The comparison date range is labeled with **B** and uses dashes.
You can compare analytics from different days, weeks, months, or use custom time ranges.
You can also compare analytics data using different [analytics tags](/doc/guides/search-analytics/guides/segments).
### Export analytics data
To export any of the [metrics](/doc/guides/algolia-recommend/analytics/metrics) from the Algolia dashboard,
click