> ## Documentation Index
> Fetch the complete documentation index at: https://algolia.com/llms.txt
> Use this file to discover all available pages before exploring further.
# Search analytics
> Understand the performance of your search, and how your users interact with your app. Optimize your relevance with Algolia search analytics.
export const Application = () =>
application
;
export const AlgoliaSearch = () => ;
export const AcademyLink = ({href, title}) => {
return Learn more about: {title};
};
Search analytics offer insights into what your users search and which results they select
through [metrics](/doc/guides/search-analytics/concepts/metrics) such as popular searches,
no results, and click-through rates.
## Search analytics in the Algolia dashboard
To access your search analytics in the Algolia dashboard:
1. Go to the [Algolia dashboard](https://dashboard.algolia.com/explorer/browse) and select your Algolia .
2. On the left sidebar, select **Search**.
3. Select your Algolia index and go to [**Analytics**](https://dashboard.algolia.com/analytics).
4. If you want to include analytics from other indices (including replicas), select **Include other indices**.
5. If you want to [segment the analytics by tags](/doc/guides/search-analytics/guides/segments), click **Toggle Analytics Tags**. Select or enter a tag for filtering.
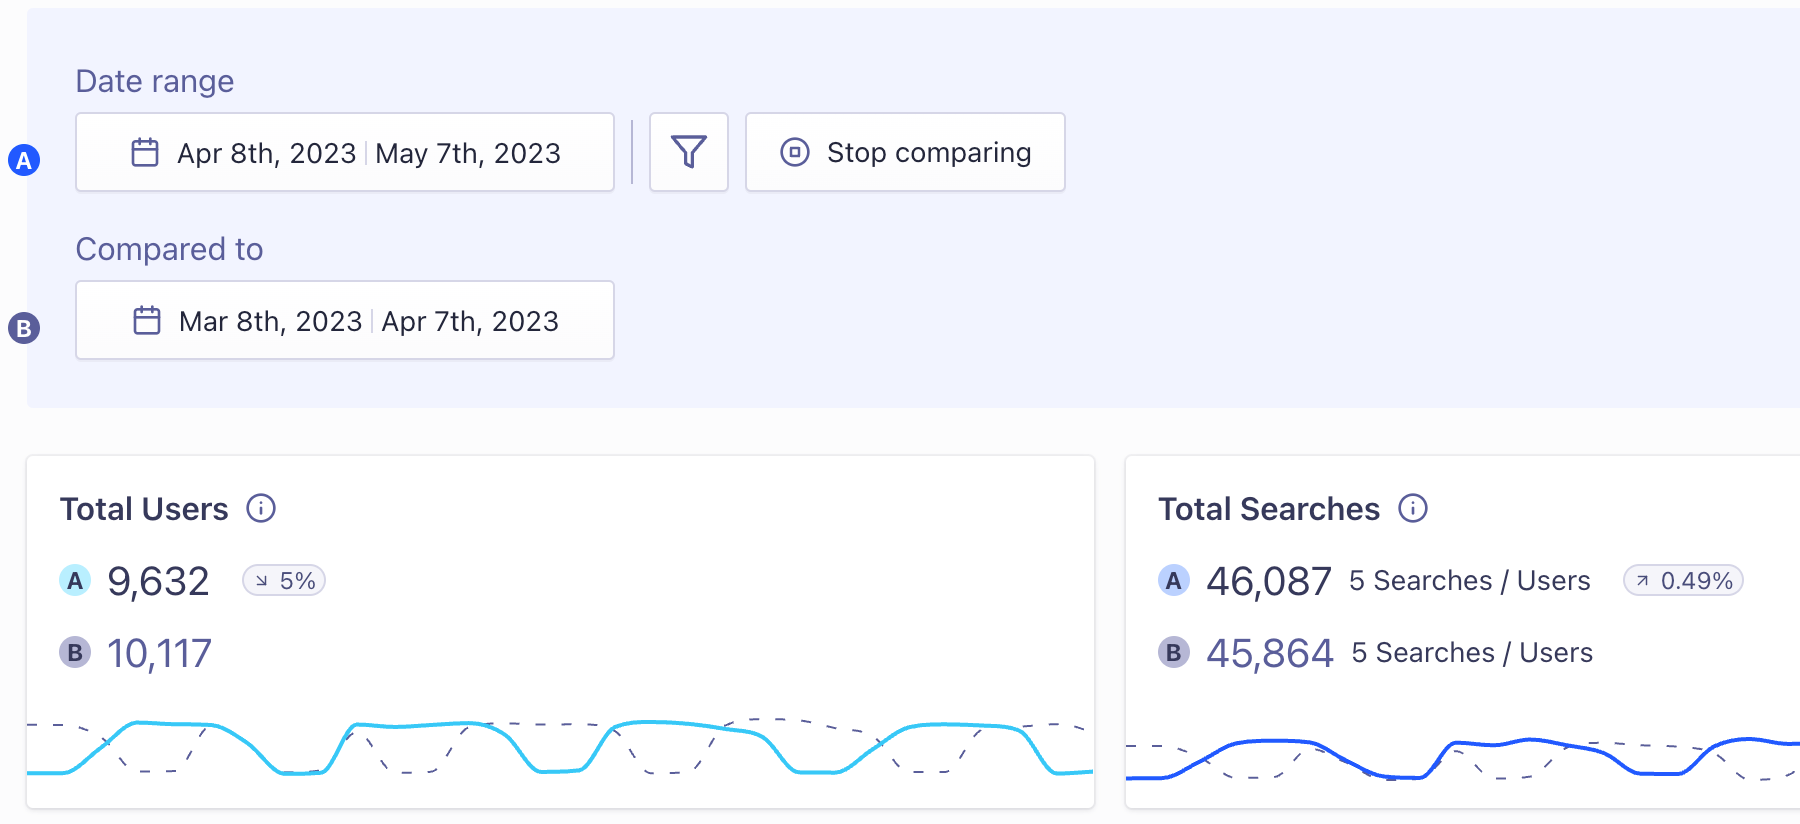
### Comparison mode
To compare the performance of your [metrics](/doc/guides/search-analytics/concepts/metrics) between different periods,
click **Comparison mode** and select the date ranges you want to compare.
The current date range is labeled **A** in the metrics graphs and uses a solid line.
The comparison date range is labeled with **B** and uses dashes.
You can compare analytics from different days, weeks, months, or use custom time ranges.
### Export analytics data
To export any of the [metrics](/doc/guides/search-analytics/concepts/metrics) from the Algolia dashboard,
click **Download**.
You can export and download your analytics data as CSV or XLSX files.
#### Export A/B test data to an external analytics platform
By default, Algolia creates an analytics tag per [A/B test](/doc/guides/ab-testing/what-is-ab-testing) variant,
which you can export while filtering on these tags to view statistics in other systems.
Use the [`getRankingInfo`](/doc/api-reference/api-parameters/getRankingInfo) parameter to retrieve the A/B test ID and variant ID.
This can help you to track user variants and behavior in third-party tools, like Google Analytics.
## Click, conversion, and revenue analytics
Some [metrics](/doc/guides/search-analytics/concepts/metrics),
such as the conversion rate, need [events](/doc/guides/sending-events) from your app or website.
Graphs and tables that involve these metrics won't display data until you start sending events.
Revenue analytics, including add-to-cart and purchase metrics, is an optional feature.
This feature isn't available on every plan.
Refer to your [pricing plan](https://www.algolia.com/pricing) to see if it's included.
## Integrate with Google Analytics
To track your search performance with Google Analytics as well as Algolia Analytics,
see [Integrate Google Analytics](/doc/guides/building-search-ui/going-further/integrate-google-analytics/js).
 The current date range is labeled **A** in the metrics graphs and uses a solid line.
The comparison date range is labeled with **B** and uses dashes.
You can compare analytics from different days, weeks, months, or use custom time ranges.
### Export analytics data
To export any of the [metrics](/doc/guides/search-analytics/concepts/metrics) from the Algolia dashboard,
click
The current date range is labeled **A** in the metrics graphs and uses a solid line.
The comparison date range is labeled with **B** and uses dashes.
You can compare analytics from different days, weeks, months, or use custom time ranges.
### Export analytics data
To export any of the [metrics](/doc/guides/search-analytics/concepts/metrics) from the Algolia dashboard,
click