Everything you need to know to interpret your A/B test results.
The Algolia A/B testing feature helps you set up an A/B test to assess whether your search strategy is successful.
Reading the results and trends from your test might seem straightforward, but there are several things to bear in mind when interpreting results.
Algolia computes A/B test results from click-through and conversion rates, based on the events you send to the Insights API.
This computation can lead to results that differ from what you see in your business data.To learn more about these rates, see:
When you run an A/B test, outlier traffic can skew the results and make them a poor match for real user traffic.
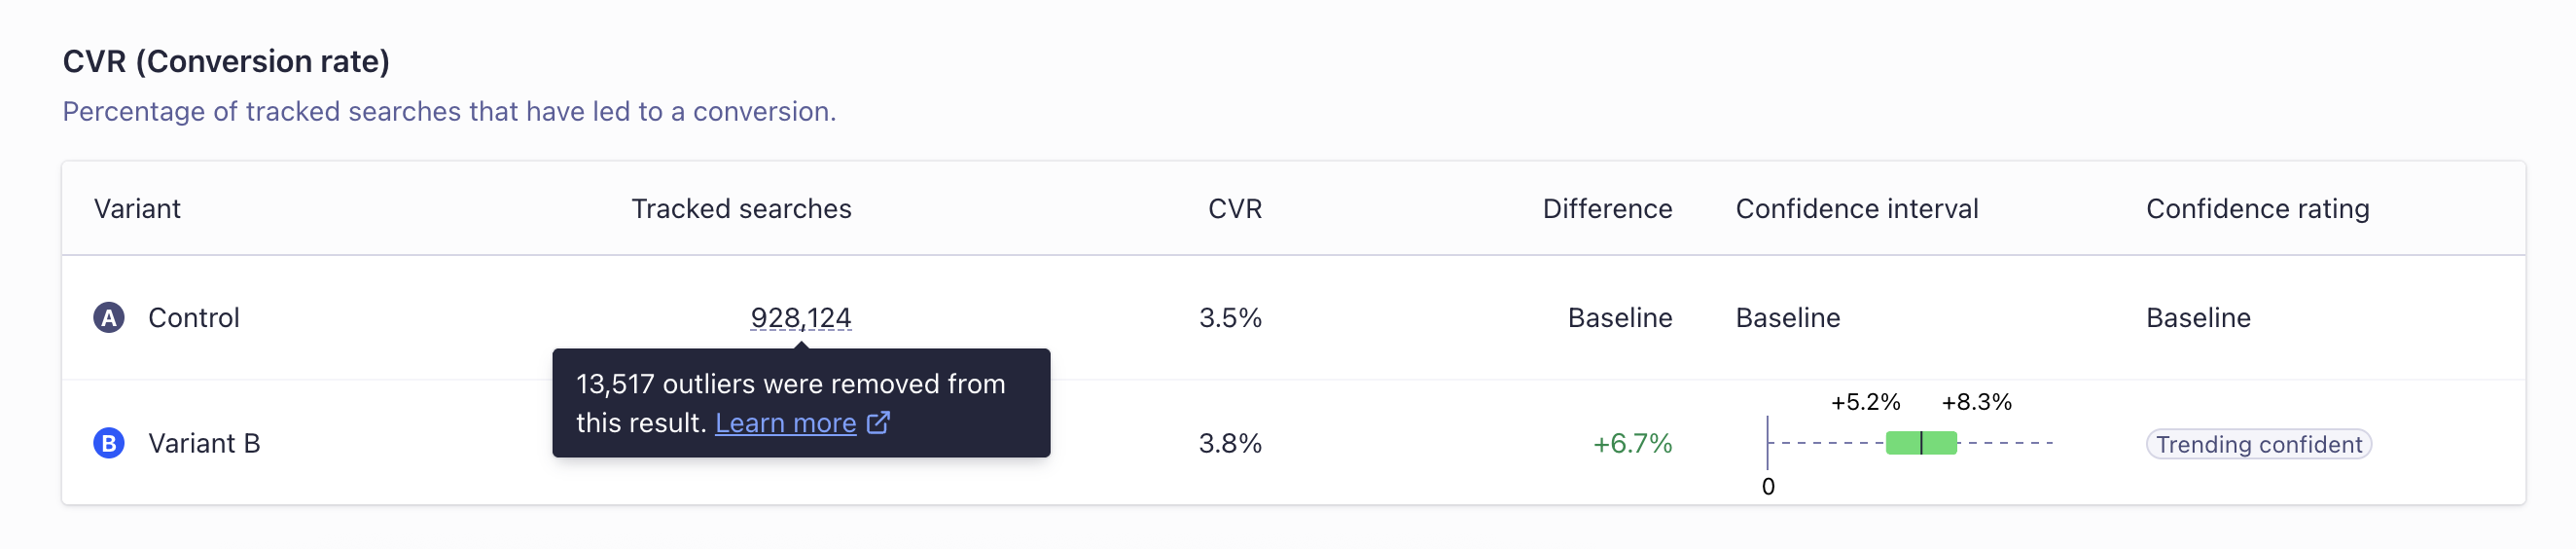
Algolia’s A/B testing feature automatically leaves out outlier users when it works out A/B test metrics.A user counts as an outlier if they run 7 standard deviations (σ) more tracked searches than the mean (μ) number of searches per user for the entire A/B test.
A tracked search is a search with the clickAnalytics parameter set to true.To check the number of outliers and the number of tracked searches that were removed from each variant, hover over the Tracked Searches and Tracked Users counts for each variant.For example, a bot that scrapes your site can trigger search requests without clicking or converting.
If the bot is assigned to variant B in an A/B test, those requests increase the number of searches without increasing clicks or conversions.
As a result, the measured click and conversion rates can decrease even if those rates increase for real users.
Removing outliers excludes this anomalous traffic, so experiment results better represent real-user activity.
Winsorizing is a statistical technique that limits extreme values in data to reduce the effect of outliers.
Instead of removing an outlier, its value stays as a data point, but gets capped to a reasonable amount.
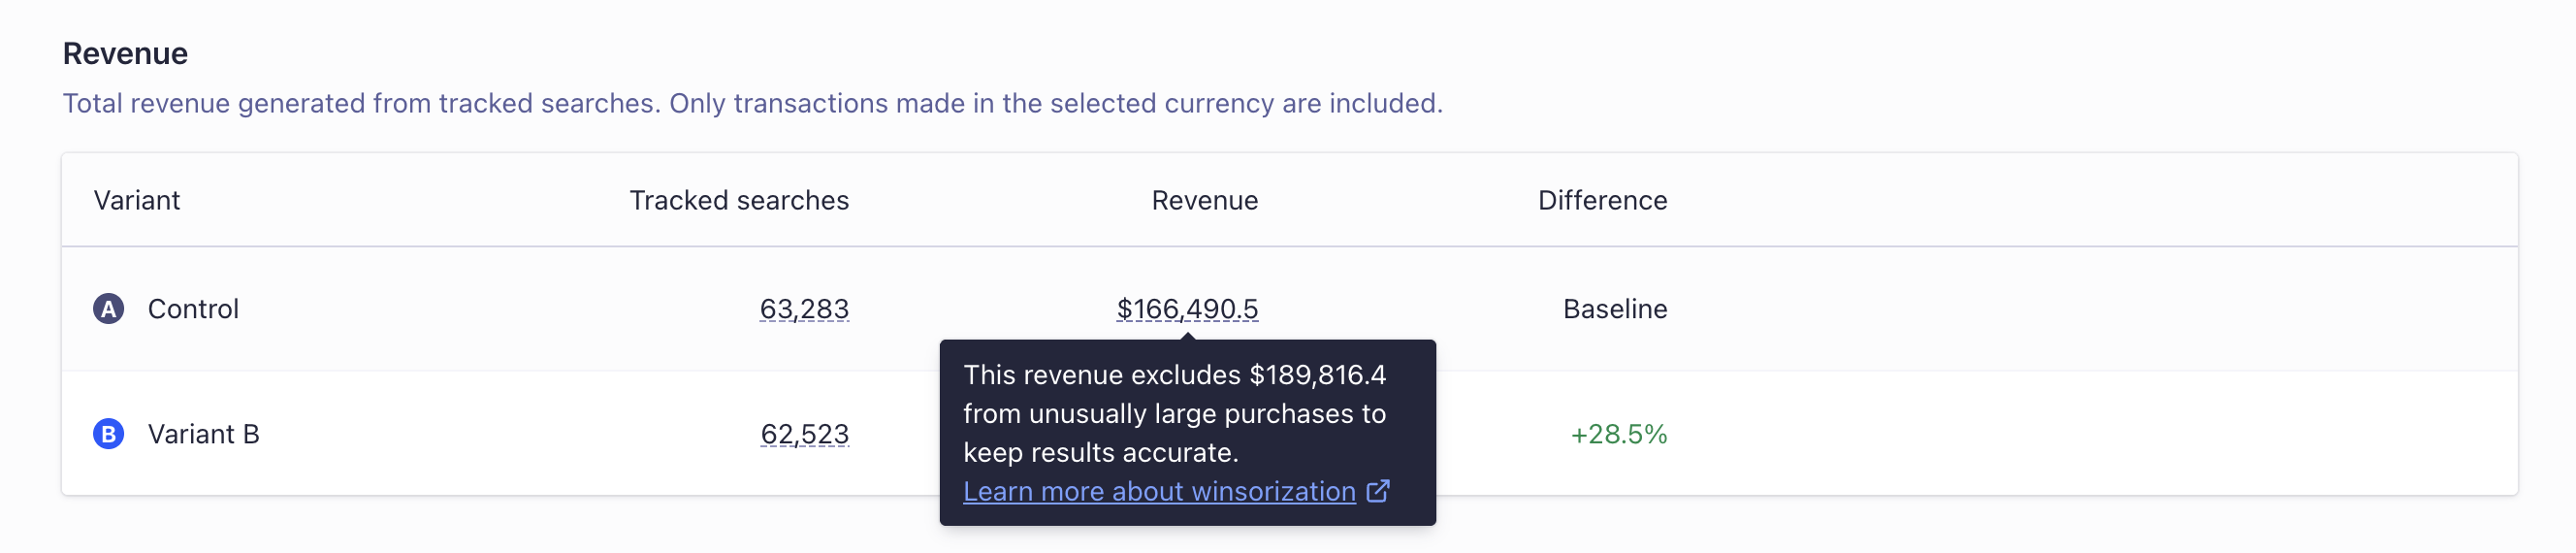
In Algolia A/B testing, winsorizing applies to revenue data to keep outlier purchases from skewing the results.When calculating the revenue for each variant, Algolia caps all purchases at the global 99th percentile.
This means unusually large purchases don’t skew the confidence result for that variant.
Instead, Algolia treats them as a purchase equal to the 99th percentile value.For example, say a user makes a $1,000 purchase, and the 99th percentile for all purchases is $100.
Algolia then counts that $1,000 purchase as $100 when it works out the revenue for that variant.
Confidence is then determined based on the adjusted revenue values, so extreme outlier purchases have a smaller effect.
As Algolia A/B testing is specific to search, the focus is on search data.
It’s best to look at the A/B test results in light of your business data to assess your test’s impact.
For example, you can cross-reference search and revenue data to compute your interpretation of conversion or to look at custom metrics.
Algolia A/B tests begin to show data in the dashboard after either 7 days have passed or 20% test completion, whichever happens first.
This is because A/B test data can be unstable at the start.
Comparing results before the test reaches 7 days or 20% completion could lead to wrong conclusions.
Even if some data is visible, it doesn’t mean that it’s the right time to make decisions based on them.
Consider the following factors before interpreting the results of an A/B test.
The probability to be best measures the likelihood that a variant outperforms the control for a given metric.
In Algolia A/B tests, a probability of at least 95% provides strong evidence that the variant outperforms the control.The credible interval shows a range of plausible values for the true uplift of a metric.
A 95% credible interval means there’s a 95% probability that the true uplift is within that range.To learn more about how these metrics are derived, see Bayesian experimentation.
As an experiment collects more searches, its estimates become more precise.
Use the evidence status to assess whether the experiment has collected enough evidence to interpret its results.An evidence status appears on the overview page and at the top of each results page.
How Algolia determines this status depends on the statistical method used for the experiment.
For Bayesian experiments, the status is based on e-values.
For frequentist experiments, the status indicates whether the test meets the configured minimum detectable effect.
Before interpreting the results or deciding what to do next, check the experiment’s confidence value.
For more information, see How A/B test scores are calculated.While an A/B test is running, its confidence value can change as new data arrives.
Treat interim values as provisional.
After the A/B test ends, the displayed confidence value no longer updates.
When setting your A/B test, you assign a percentage of search traffic to each variant (by default, 50/50).
The displayed search count should reflect the expected traffic split.
For most A/B test configurations, the search count for each variant should match the traffic split.
If there’s a noticeable discrepancy, there’s probably an issue.For example, you could have a 50/50 split, ending up with 800,000 searches on one side and 120,000 on the other.
The results are unreliable if you see a difference higher than 20% from the expected number.Algolia attempts to identify and ignore any unusual data (outliers) when calculating A/B test results.
But if there’s a big gap between the traffic you expected and the traffic you got, investigate your A/B test setup.
This helps you figure out why there’s a mismatch.
Each confidence interval is comparing the variant with control, and Algolia doesn’t show any variant to variant comparisons.
Algolia implements a relative confidence interval, which normalizes the control to zero.
Over time, the confidence interval decreases.
A variant is statistically significant when the colored band doesn’t overlap zero.
Sales or holidays (such as Black Friday) can affect your test, with more out-of-stock items, for example.
If you see unexpected results, check whether you’ve been conducting the A/B test during a special period.For more information, see A/B test implementation checklist.
If using a replica, ensure re-ranking does have an impact: queries should be re-ranked for this index.
If not, change its events source index to the primary index for Dynamic Re-Ranking.
Check whether Personalization is also enabled for the index you’re testing.
The analysis isn’t optimal when you enable Personalization: it counts traffic towards Dynamic Re-Ranking even when that traffic probably doesn’t matter.
As soon as Algolia detects a Personalization , Dynamic Re-Ranking no longer has any effect.
Dynamic Re-Ranking isn’t optimized for use cases like marketplaces with short-lived items.
If this is your case, you may see A/B test results that aren’t ideal.
If you’re using distinct, Algolia regroups items, so Dynamic Re-Ranking has less impact.
The confidence calculation involves ratios.
Even if you set up the test as intended, there’s no guarantee it reaches confidence.Your data could be trending confident one day but inconclusive some days later.Some of the reasons for this are:
Variability in the data: A/B test results can vary a lot when the sample size is small.
At the start of the test, chance alone might explain the difference you see.
As you collect more data, the true difference, if any, becomes clearer.
External factors: outside events can influence how users behave.
For example, if you’re testing changes on an ecommerce site, a major holiday, sale, or event could skew results for a while.
Sampling bias: if the kind of user or their behavior changes during the test, for example due to a change in traffic source, a product release, or a marketing campaign, it can influence results.
Check the following if the A/B test doesn’t achieve confidence:
Review your test setup: make sure no technical issues or changes happened during the test that could affect the results.
Confirm the groups still split as configured, and that no outside factors crept in.
Consider external factors: were there any external events or factors that could have influenced the results?
Understanding these can help you interpret confidence.
Increase the sample size: if the sample size is small, keep running the test to collect more data.
A larger sample size, for example by running the test for longer, can give more accurate and stable results.
Adjust the split: if the sample size is large but confidence is still low, consider changing the split to increase the number of users in each group.
For example, if the split is 70/30, try 60/40 or 50/50.
Uneven splits can help limit exposure to a high-risk change, but they also need a larger sample size to reach confidence.
Click-through rate is going up and conversion rate is going down
This probably means that top search results don’t convert.
Potential causes include out-of-stock products, items with the wrong picture, misleading descriptions, or unavailable sizes.
In such cases, you can use filtering to remove unavailable products, fix the relevance implementation to rank certain items higher, or clean up your data.If possible, also look at your own business intelligence metrics to confirm/deny the results you’re seeing.
If you’re looking at revenue, for instance, what’s the impact of the A/B test?
Click-through and conversion rates are both going down
You might go through every possible check for your A/B test and Insights API implementation, and still find nothing that explains the results.
Perhaps the settings you’re testing aren’t a good strategy for your search: keep iterating to find a successful strategy.Contact the Algolia support team for further help.