Let’s look at a few common examples.
Size Coverage
Nothing is more frustrating than seeing the perfect garment or shoes only to click through and find your size is sold out.
When a brand new customer lands on your site or app and you have no data to personalize their experience with, showing them products with all sizes available is a good idea. Or you could take a slightly different approach and suppress products where your core sizes are out of stock. There are a few ways you can represent this in your data.
The obvious way is to have stock levels for each size, that can be useful for segmentation but it’s hard to work with in broad-brush strategies. Another option is to calculate a percentage of the sizes that are in stock. This can work well but it ignores popularity of sizes, for example a product sold out in small and medium would have the same value as a product sold out in XXXS and XXXL.
True/false flags denoting fully stocked and core sizes in stock have several advantages. They’re easy to understand and can be incorporated easily in to rules and base ranking settings.
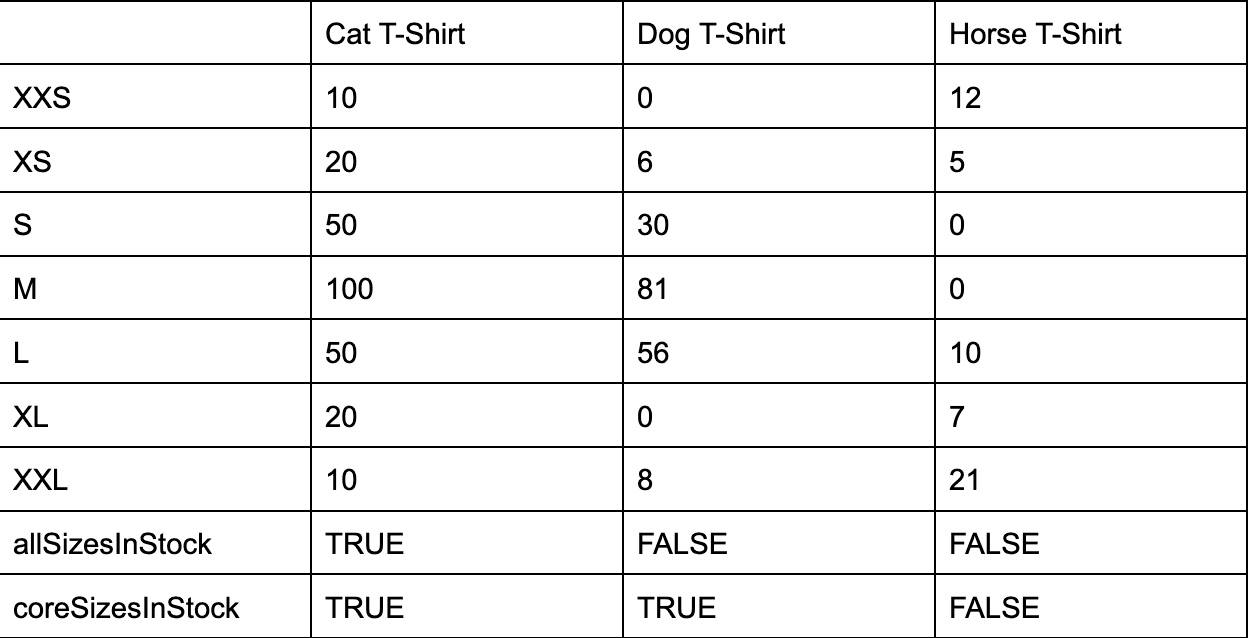
Imagine a website selling t-shirts, sizes XXS to XXL, with S,M,L as the most popular sizes.
The table below shows three products and their stock levels for each size together with true/false flags.
These simple flags can be used in all manner of ways.
- Only show fully stocked products on the home page.
- Only show new customers products with core sizes in stock.
- Only display recommendations with a full size range.
- Favor products with core sizes globally on some or all category pages
Weeks Cover
Many businesses track their stock position using weeks cover or weeks on hand. Bringing this metric in to your product data allows you to factor it in to your merchandising strategy. A simple numeric value works well although we recommend rounding to a whole number. Another approach is to define high and low thresholds and add true/false flags as described for size coverage.
Other Metrics
Enriching your product data with business metrics is only limited by the data you have and your creativity in using it.
As a general rule, true/false data types are preferable, followed by bucketed numerical values. Granular numbers and text strings have their place but are harder to use effectively.
One Algolia customer found that first time customers who returned all or part of their first order were significantly less likely to make a second purchase. Digging into the data further they found that certain products had a very low returns rate and customers who made their first purchase of one of these products were much more likely to place a second order. By simply adding a true/false flag to products with a very low returns rate they were able to boost them for new customers.
A few more examples to inspire you:
- Is on sale
- High margin
- Review ratings
- Is new
- Discontinued
- Season
- Product tier (good, better, best, represented numerically as 1,2,3)
- Featured Brand
 Starten Sie kostenlos
Die weltweit fortschrittlichste KI-Suche
Starten Sie kostenlos
Die weltweit fortschrittlichste KI-Suche AI Browse
Von KI erstellte Kategorie- und Sammlungsseiten
AI Browse
Von KI erstellte Kategorie- und Sammlungsseiten AI Recommendations
Vorschläge überall auf der User Journey
AI Recommendations
Vorschläge überall auf der User Journey Merchandising Studio
Datengestützte Kundenerlebnisse, ohne Code
Merchandising Studio
Datengestützte Kundenerlebnisse, ohne Code Merchandising Studio
Datengestützte Kundenerlebnisse, ohne Code
Merchandising Studio
Datengestützte Kundenerlebnisse, ohne Code Analytics
Alle Ihre Erkenntnisse in einem Dashboard
Analytics
Alle Ihre Erkenntnisse in einem Dashboard UI Components
Pre-built components for custom journeys
UI Components
Pre-built components for custom journeys

