

Before you begin
Check that you have:- Sent events for the metric you want to measure: click events for click-through rate (CTR), conversion events for conversion rate (CVR), and add-to-cart or purchase conversion events for add-to-cart rate (ATCR) and purchase rate.
- Tested the control and variant configurations with your search UI. For example, changes to a can affect filtering, and ranking changes can reduce search relevance.
If your control index hasn’t received search traffic or click or conversion events in the last 7 days, the dashboard shows a warning.
You can continue, but the test might not collect enough data for useful results.
Create and launch a test
1
Choose a test type
Select your Algolia application and open the A/B Testing page.
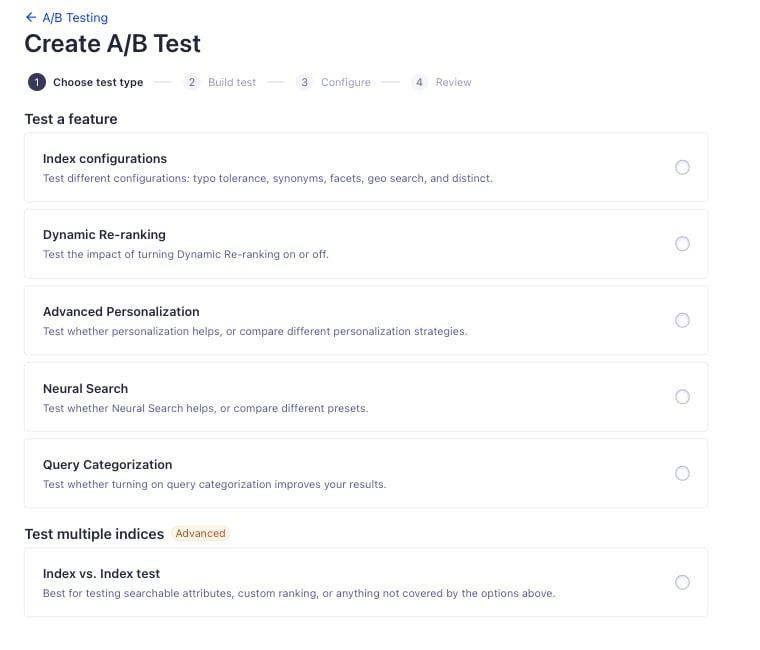
Click Create test, then select an option:
-
Test a feature. The control and variants share one index.
- Index configurations. Compare search-time settings such as typo tolerance, synonyms, facets, geo search, and distinct.
- Dynamic Re-Ranking. Test turning Dynamic Re-Ranking on or off.
- Advanced Personalization. Test whether personalization helps, or compare personalization strategies. For more information, see A/B test Advanced Personalization.
- NeuralSearch. Test whether NeuralSearch helps, or compare presets. For more information, see NeuralSearch A/B testing.
- Query Categorization. Test whether Query Categorization improves results.
-
Test multiple indices. Select Index vs. Index test to compare separate indices or replicas.
Use it for settings that need separate indices, such as searchable attributes or custom ranking, or for anything the feature tests don’t cover.
2
Build the test
-
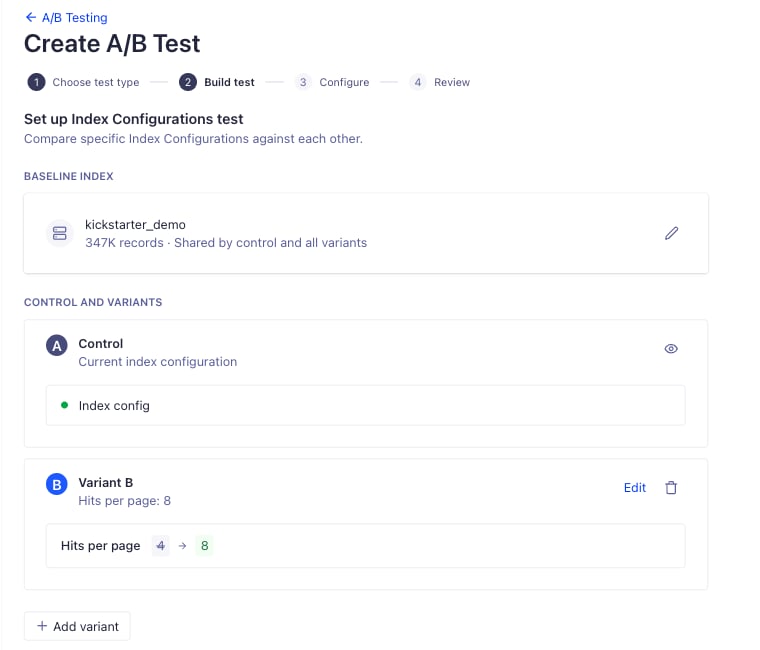
Baseline index:
- For feature tests, the baseline index is shared by the control and all variants. To change it, click the pencil icon and select the index that receives your production search traffic.
- For an Index vs. Index test, select a separate index for the control and for each variant.
-
Control and variants:
-
Control uses the baseline index as it’s configured today.
Index config means the control runs with the index’s current settings and no changes.
- Click Add variant, then set the change you want to measure, such as a different number of hits per page. To change a variant, click Edit. To remove it, click the trash icon. You need at least one variant before you can continue.
-
Control uses the baseline index as it’s configured today.
3
Configure the test
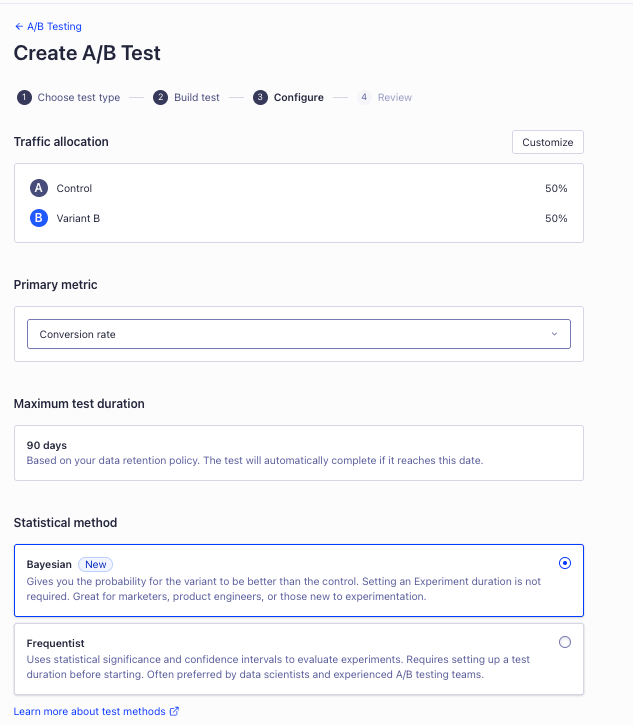
- Traffic allocation. The dashboard splits traffic equally between the control and variants. To change the split, click Customize and enter a percentage for each. Keep an equal split unless you want to limit exposure to an untested configuration.
- Primary metric. For Index configurations and Index vs. Index test, select the metric the test measures: Your app must send the matching events.
-
Statistical method.
- Bayesian gives the probability that a variant beats the control. It’s the default. It doesn’t require you to choose a duration before starting the test.
- Frequentist uses statistical significance and confidence intervals. It requires a planned duration.
-
Test duration.
- With a Bayesian test, the dashboard sets a Maximum test duration. The test completes automatically when it reaches it.
-
With a frequentist test, for Estimated duration, select the smallest relative change you want to detect.
The dashboard estimates the duration from your historical traffic and events.
For more information, see Understand sample size and test duration.
4
Review and launch the test
Enter a descriptive Name and an optional Hypothesis.
Under Review test details, check the test type, test detail (baseline index, variants, and parameters tested), and configurations (primary metric and duration).
To change a section, click its edit icon.If everything looks correct, click Launch test.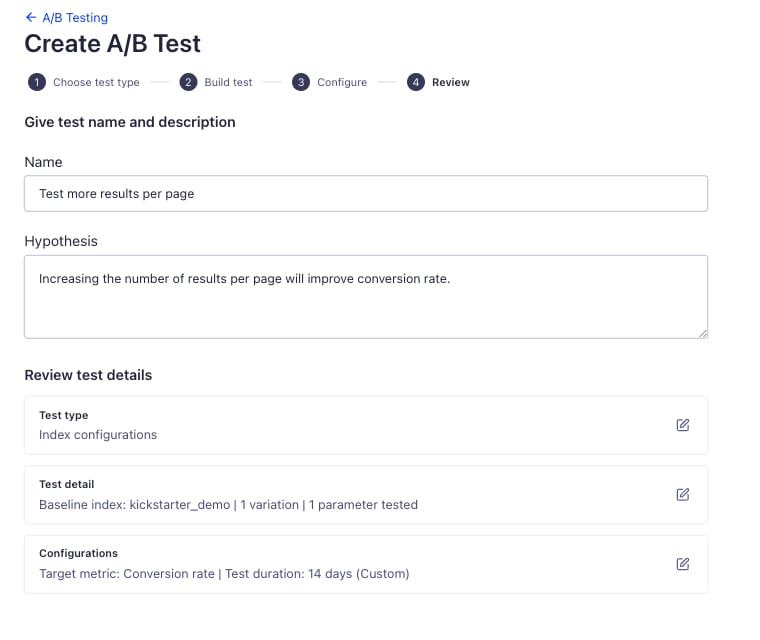
Understand sample size and test duration
For frequentist tests, use the sample size estimator to estimate how many searches you need and how long the test should run.Sample size estimator
The estimator uses historical traffic and a baseline metric, such as conversion rate or click-through rate. Select the metric and the smallest relative change you want to detect. The calculation uses 80% statistical power and a 5% significance level, adjusted for multi-variant testing. The estimator rounds the duration up to whole weeks to account for traffic patterns.Choose an appropriate effect size
The effect size is the smallest relative change in a metric you consider large enough to act on. For example, if you would adopt a change only if it increases your conversion rate by 5%, set your effect size to 5%. With a baseline conversion rate of 10%, a 5% relative increase corresponds to a conversion rate of 10.5%. Use this target to estimate the required sample size. An observed rate of 10.5% alone doesn’t establish statistical significance. The sample-size estimator shows the number of searches required to detect that improvement with 80% power at a 5% significance level (adjusted in multi-variant testing). When choosing an effect size, consider:- Impact. Consider the smallest change that would make a meaningful improvement in your goals. For example, a 2% relative increase in conversion rate might be significant for you, while another organization might aim for a 5% relative change.
- Historical data. Review past experiments to understand typical variations and set an effect size that’s realistic and achievable based on historical performance. For example, if other changes you have tested result in a 3% relative increase in conversion rate, you might set your effect size to 3%.
- Balance between sensitivity and practicality. Smaller effect sizes, such as 1% to 2%, require larger sample sizes but let you detect subtle changes. Larger effect sizes (for example, 5% to 10%) require smaller samples and are easier to detect but may overlook smaller, yet important, changes.
View the results
Open a test from the overview page to review its status, variants, and metrics.Overview page
The overview page lists the A/B tests in your , including each test’s ID, name, start date, planned duration, and status. The list shows active tests first, followed by other tests from newest to oldest. To change the sort order, click the chevron next to Start date.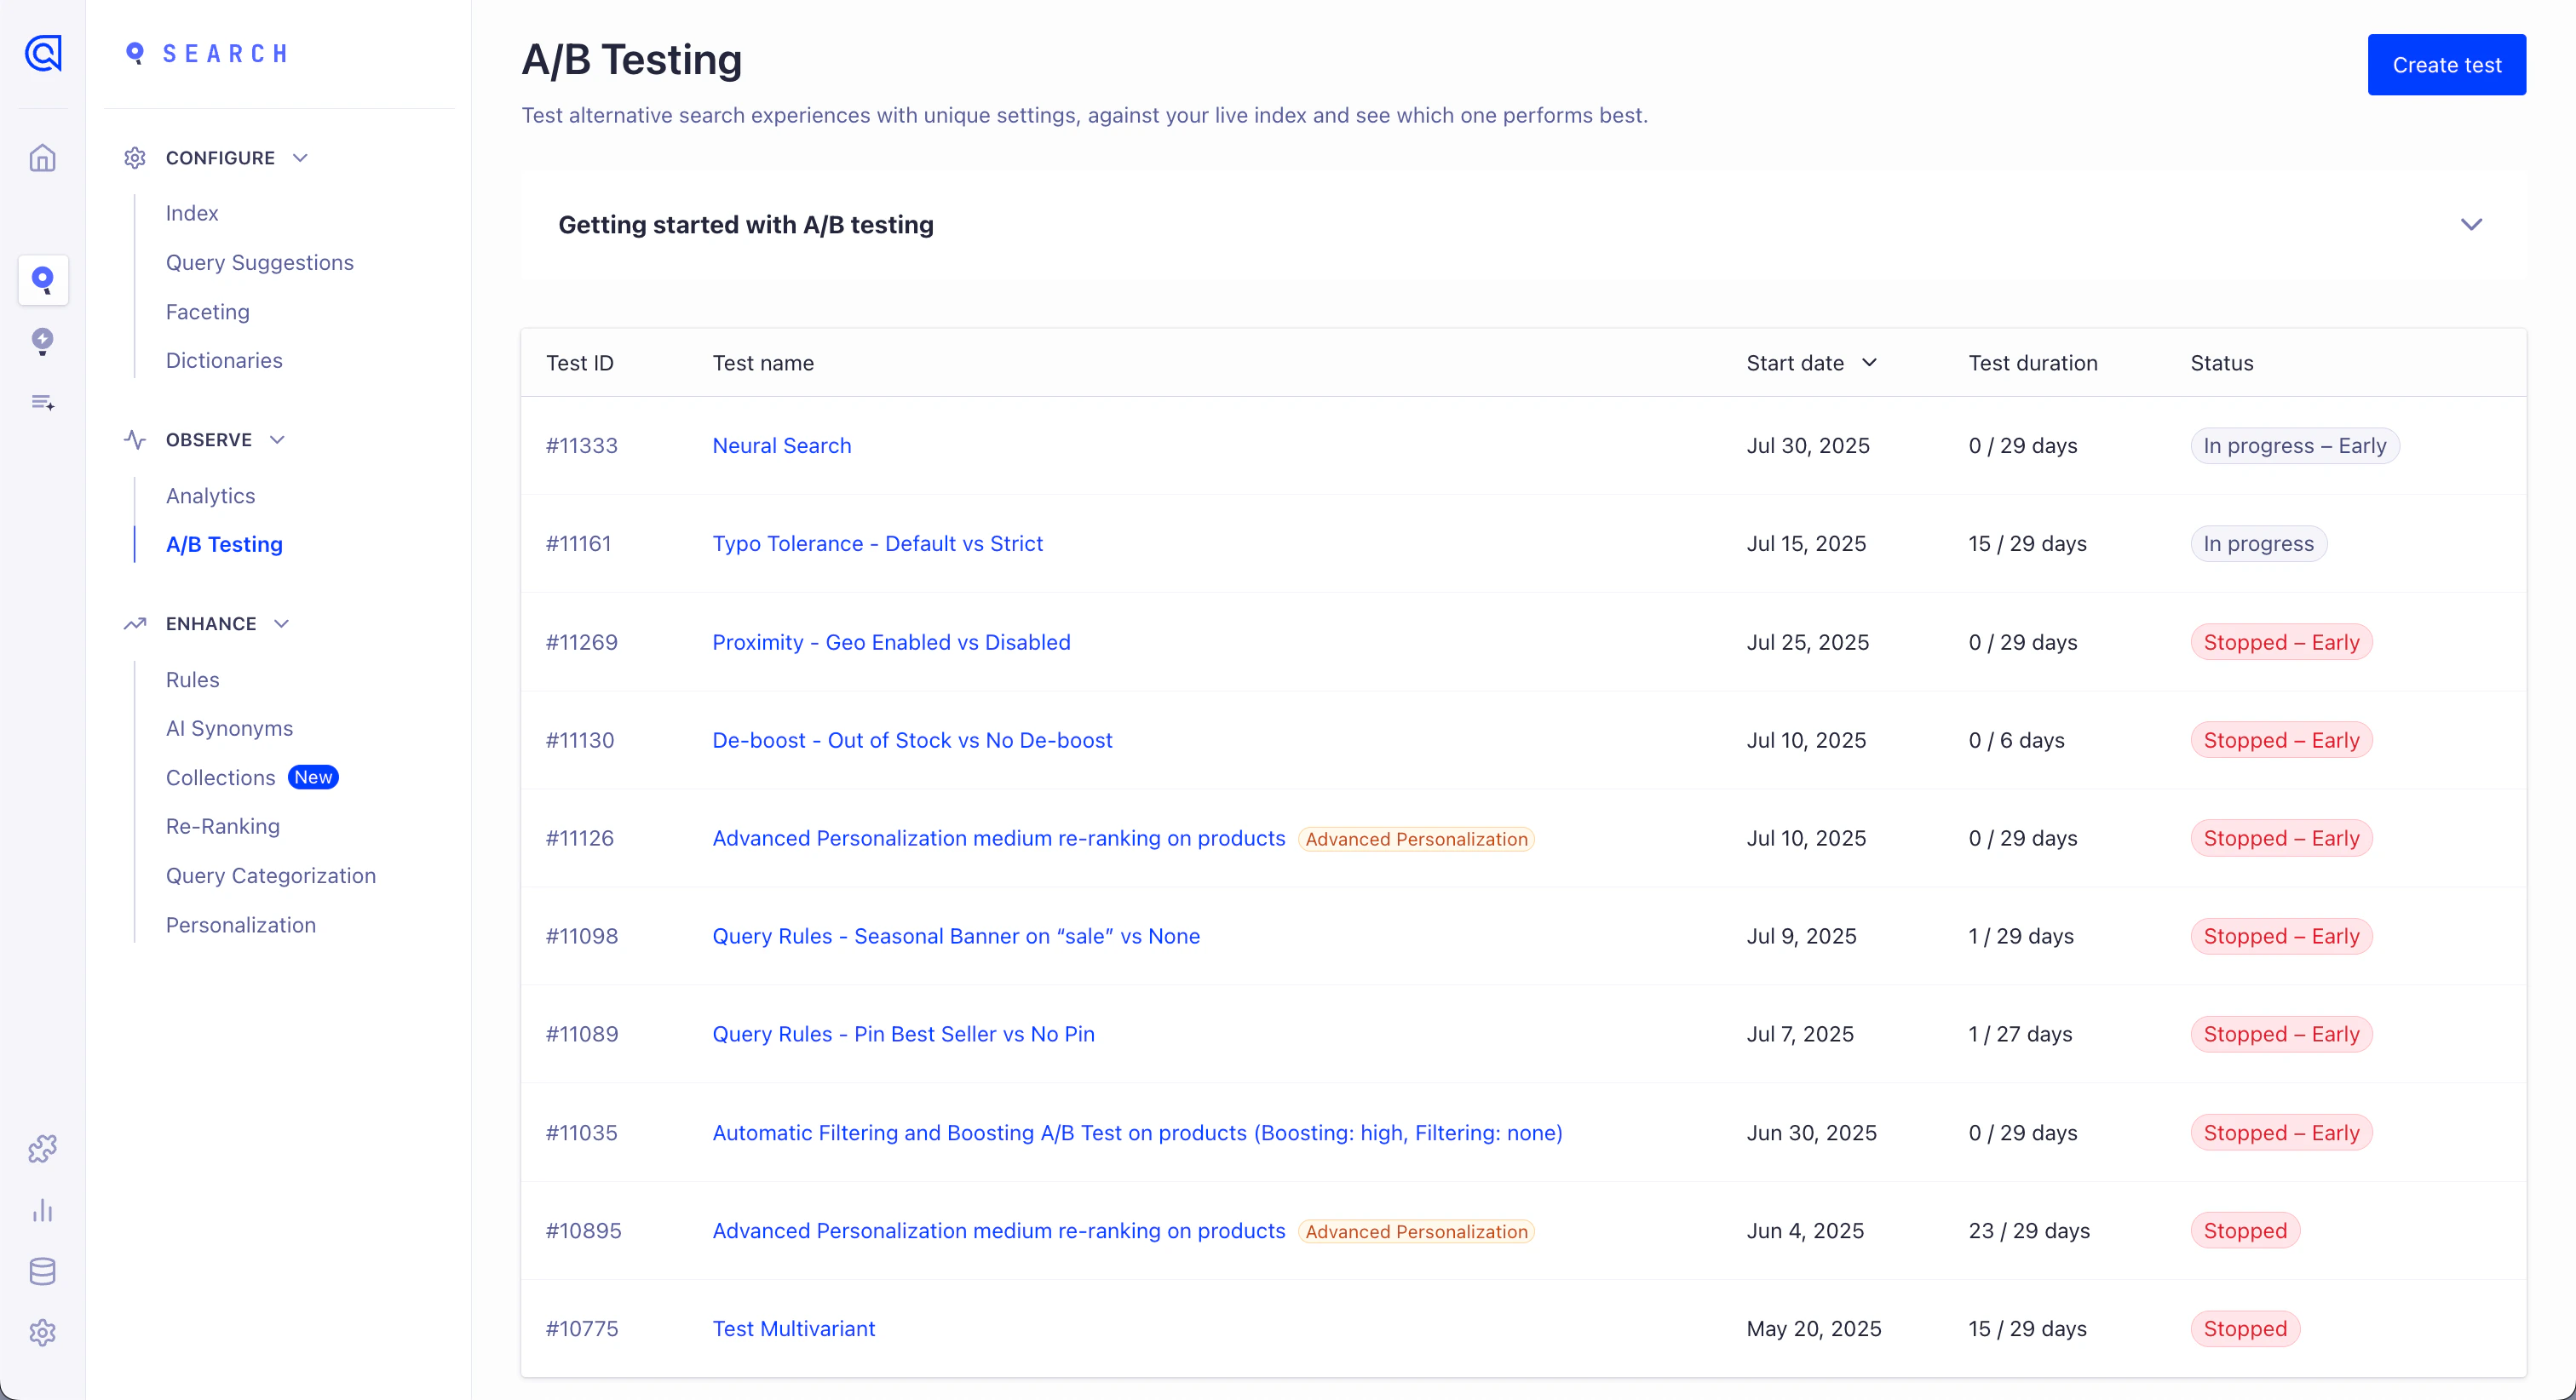
A/B test details page
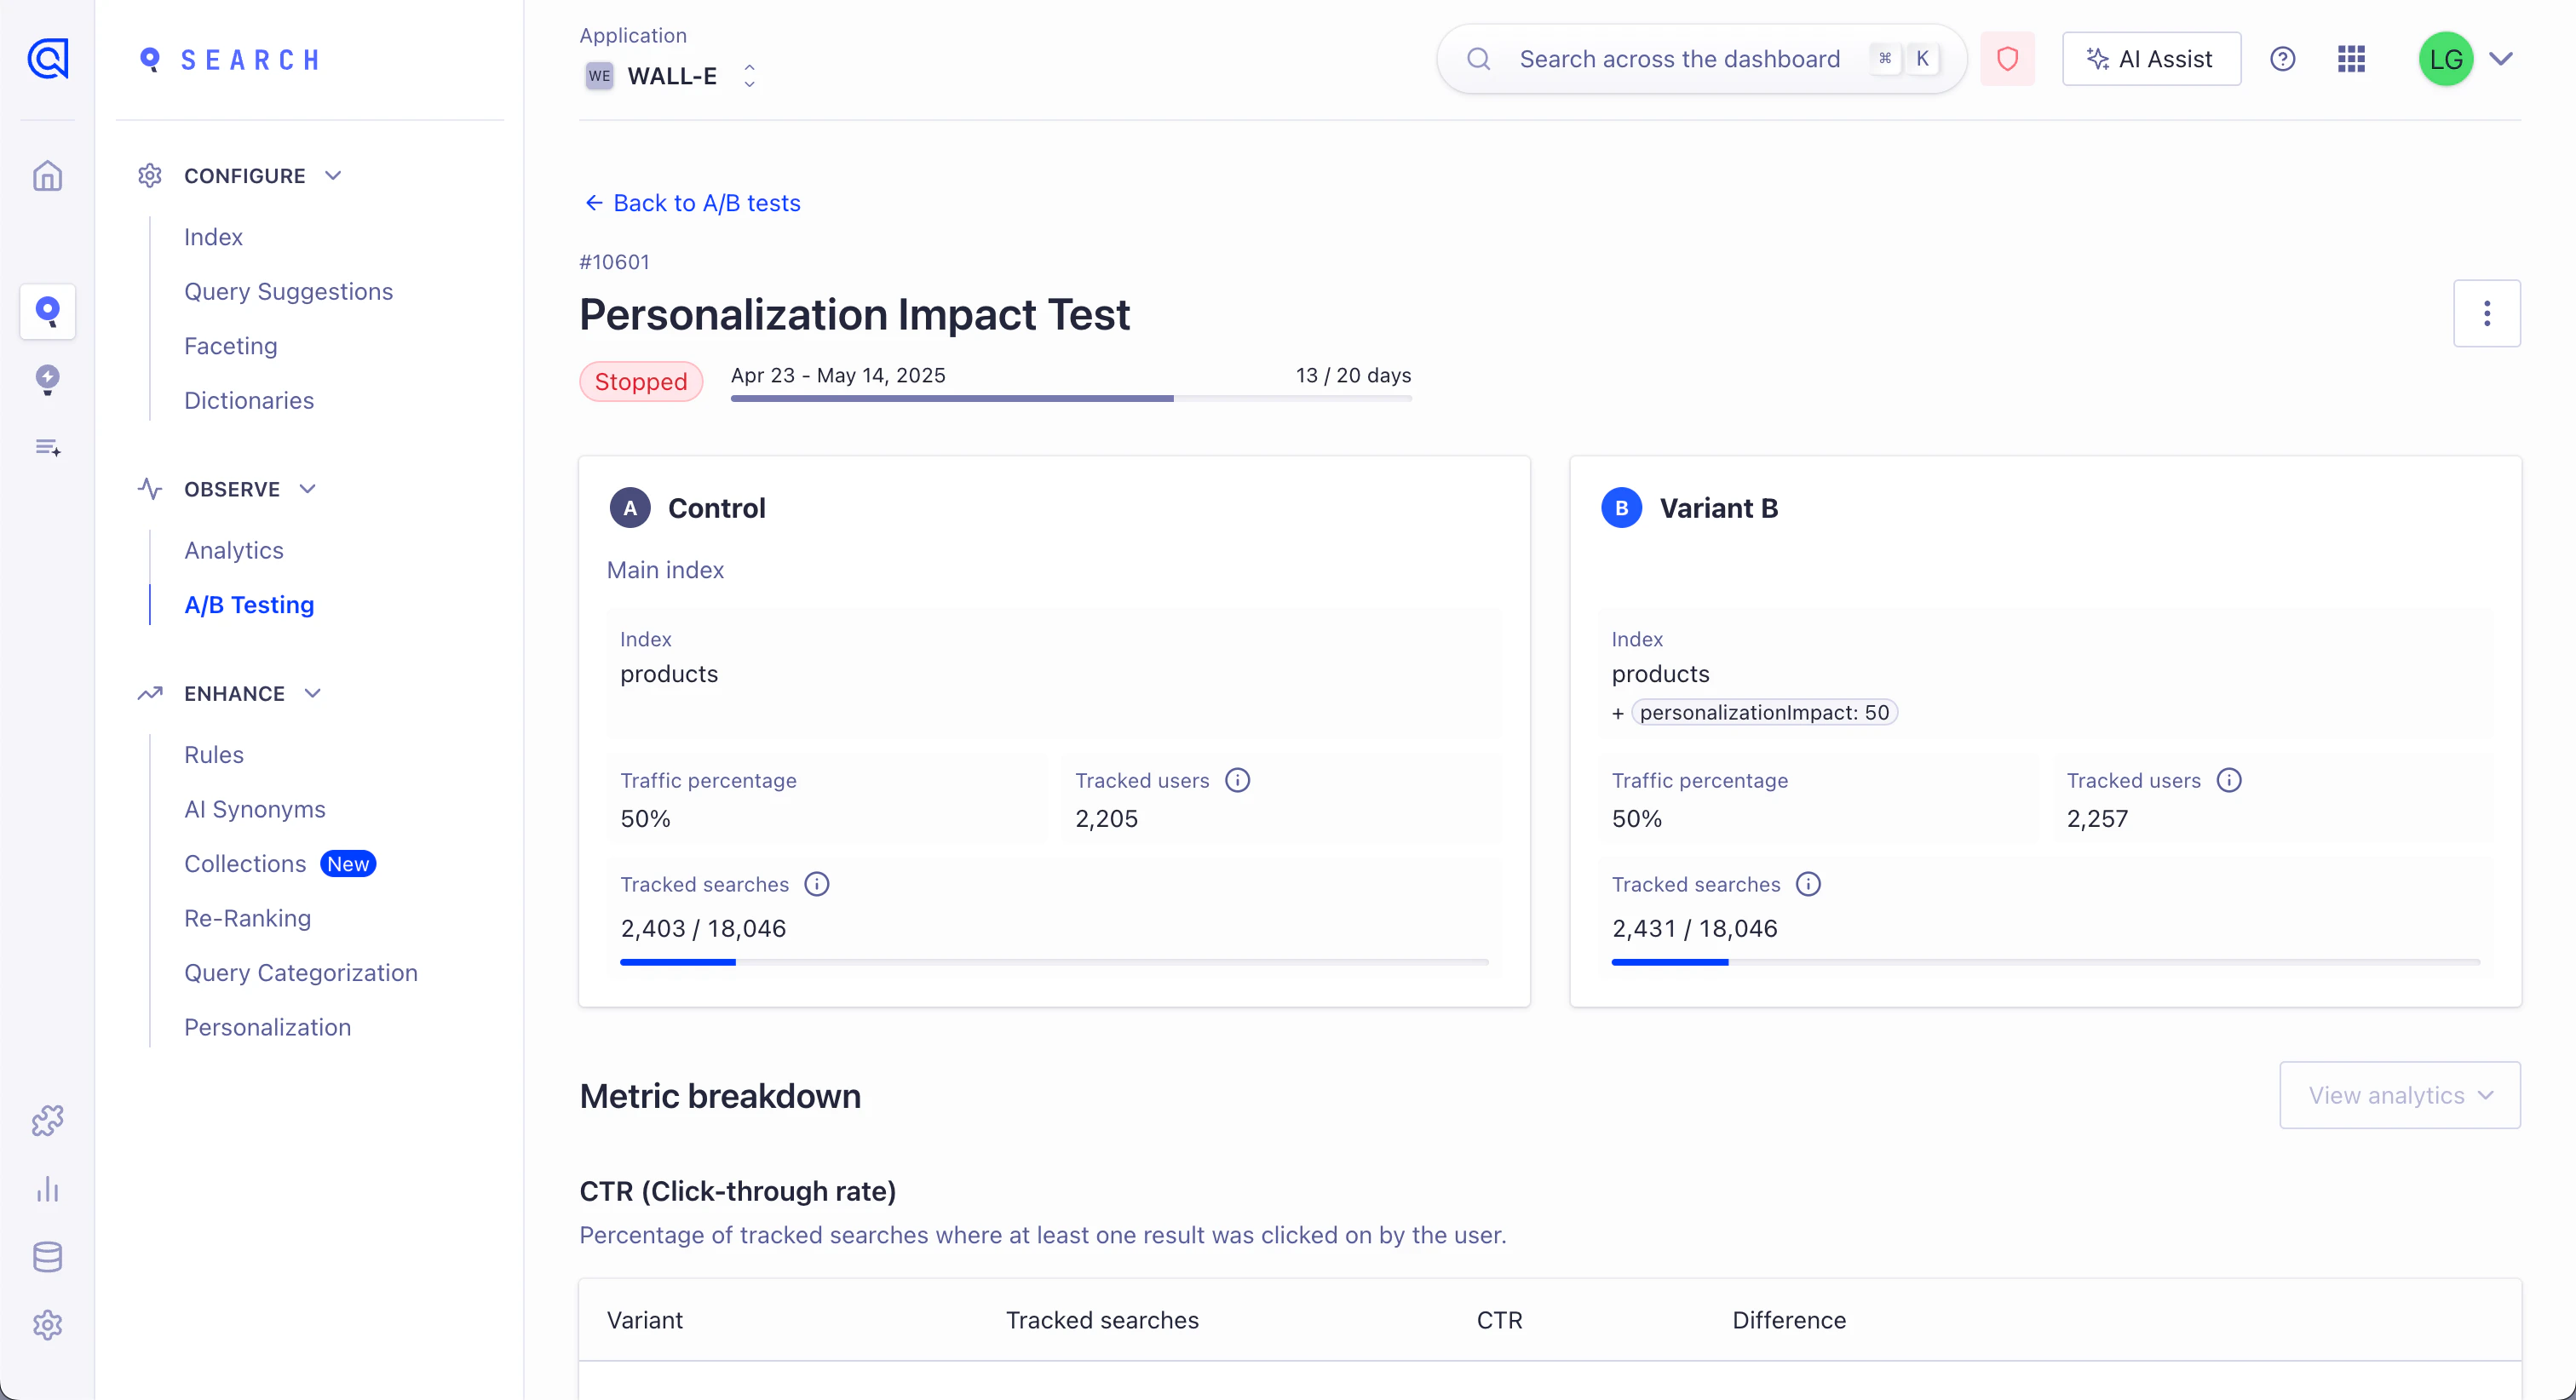
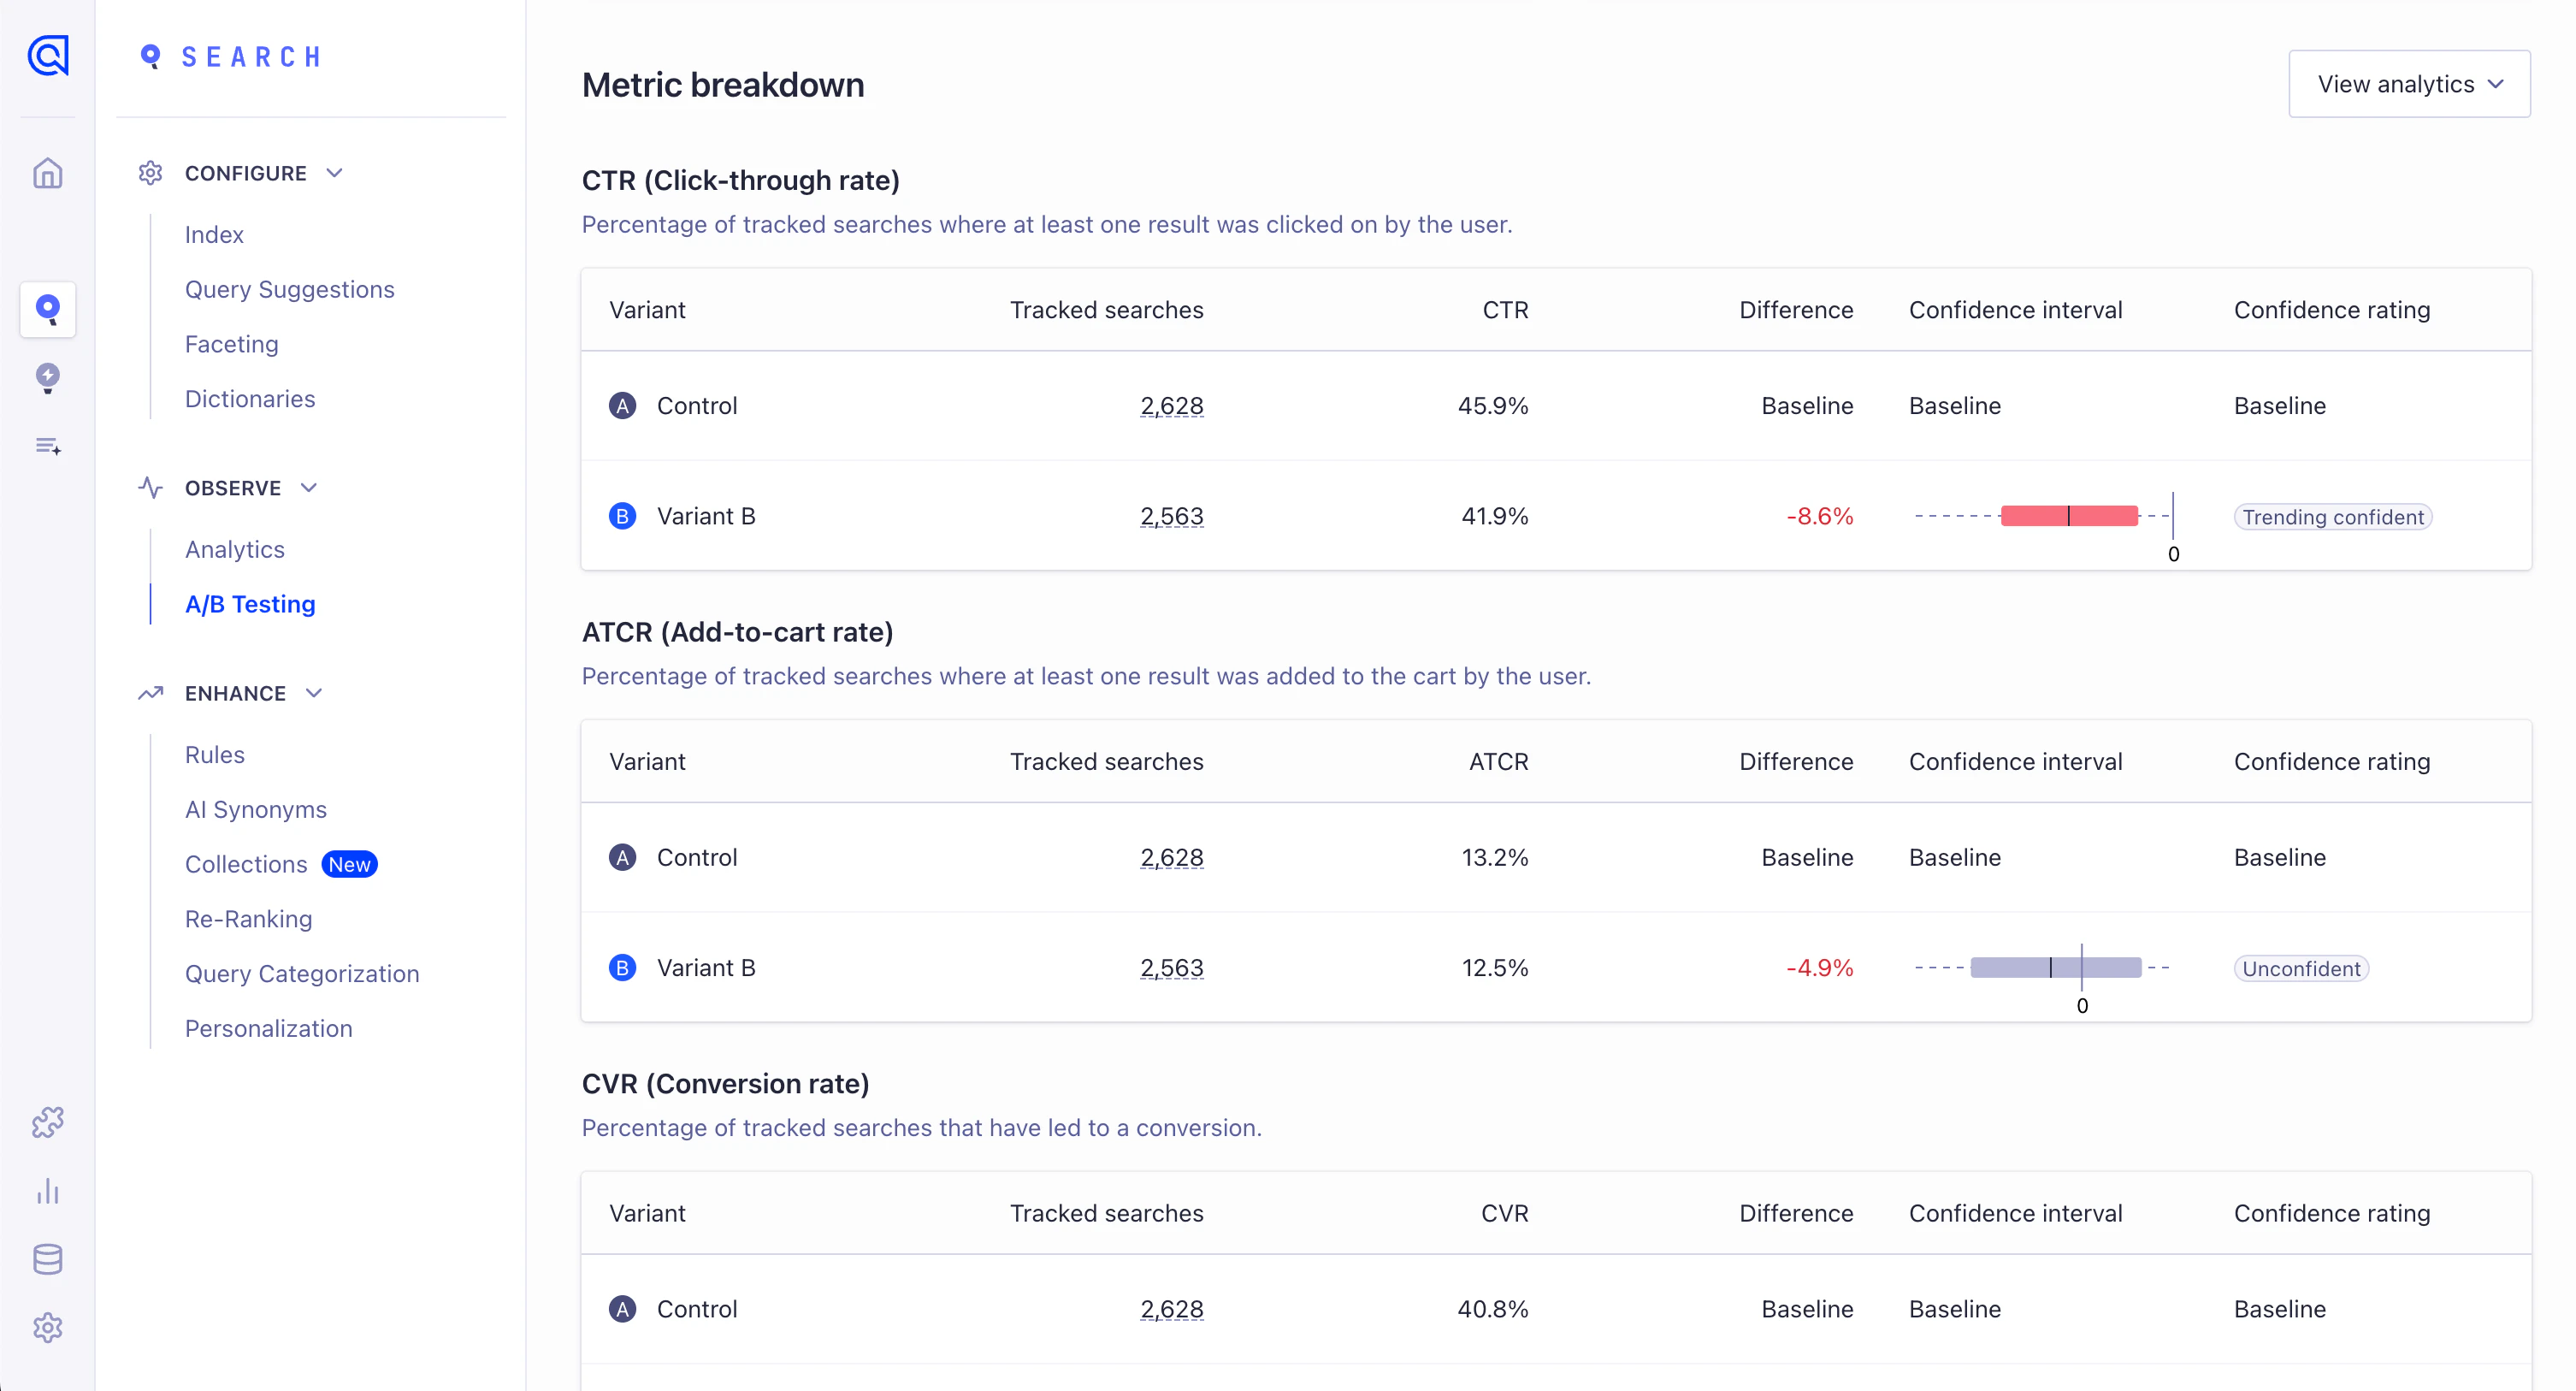
- Variant. The tested variant.
- Tracked searches. Searches with
clickAnalyticsset totrue. Metrics that don’t require this parameter use Searches instead. - Metric value. The observed value of the metric (for example, CTR, or ATCR).
- Difference. The relative change from the control, expressed as a percentage.
- Confidence interval. A range that expresses uncertainty in the estimated relative change from the control.
- Confidence rating. Shows how reliable the observed difference is (for example, trending confident, or unconfident). For details, see Confidence. Hover over any rating to see the exact p-value.
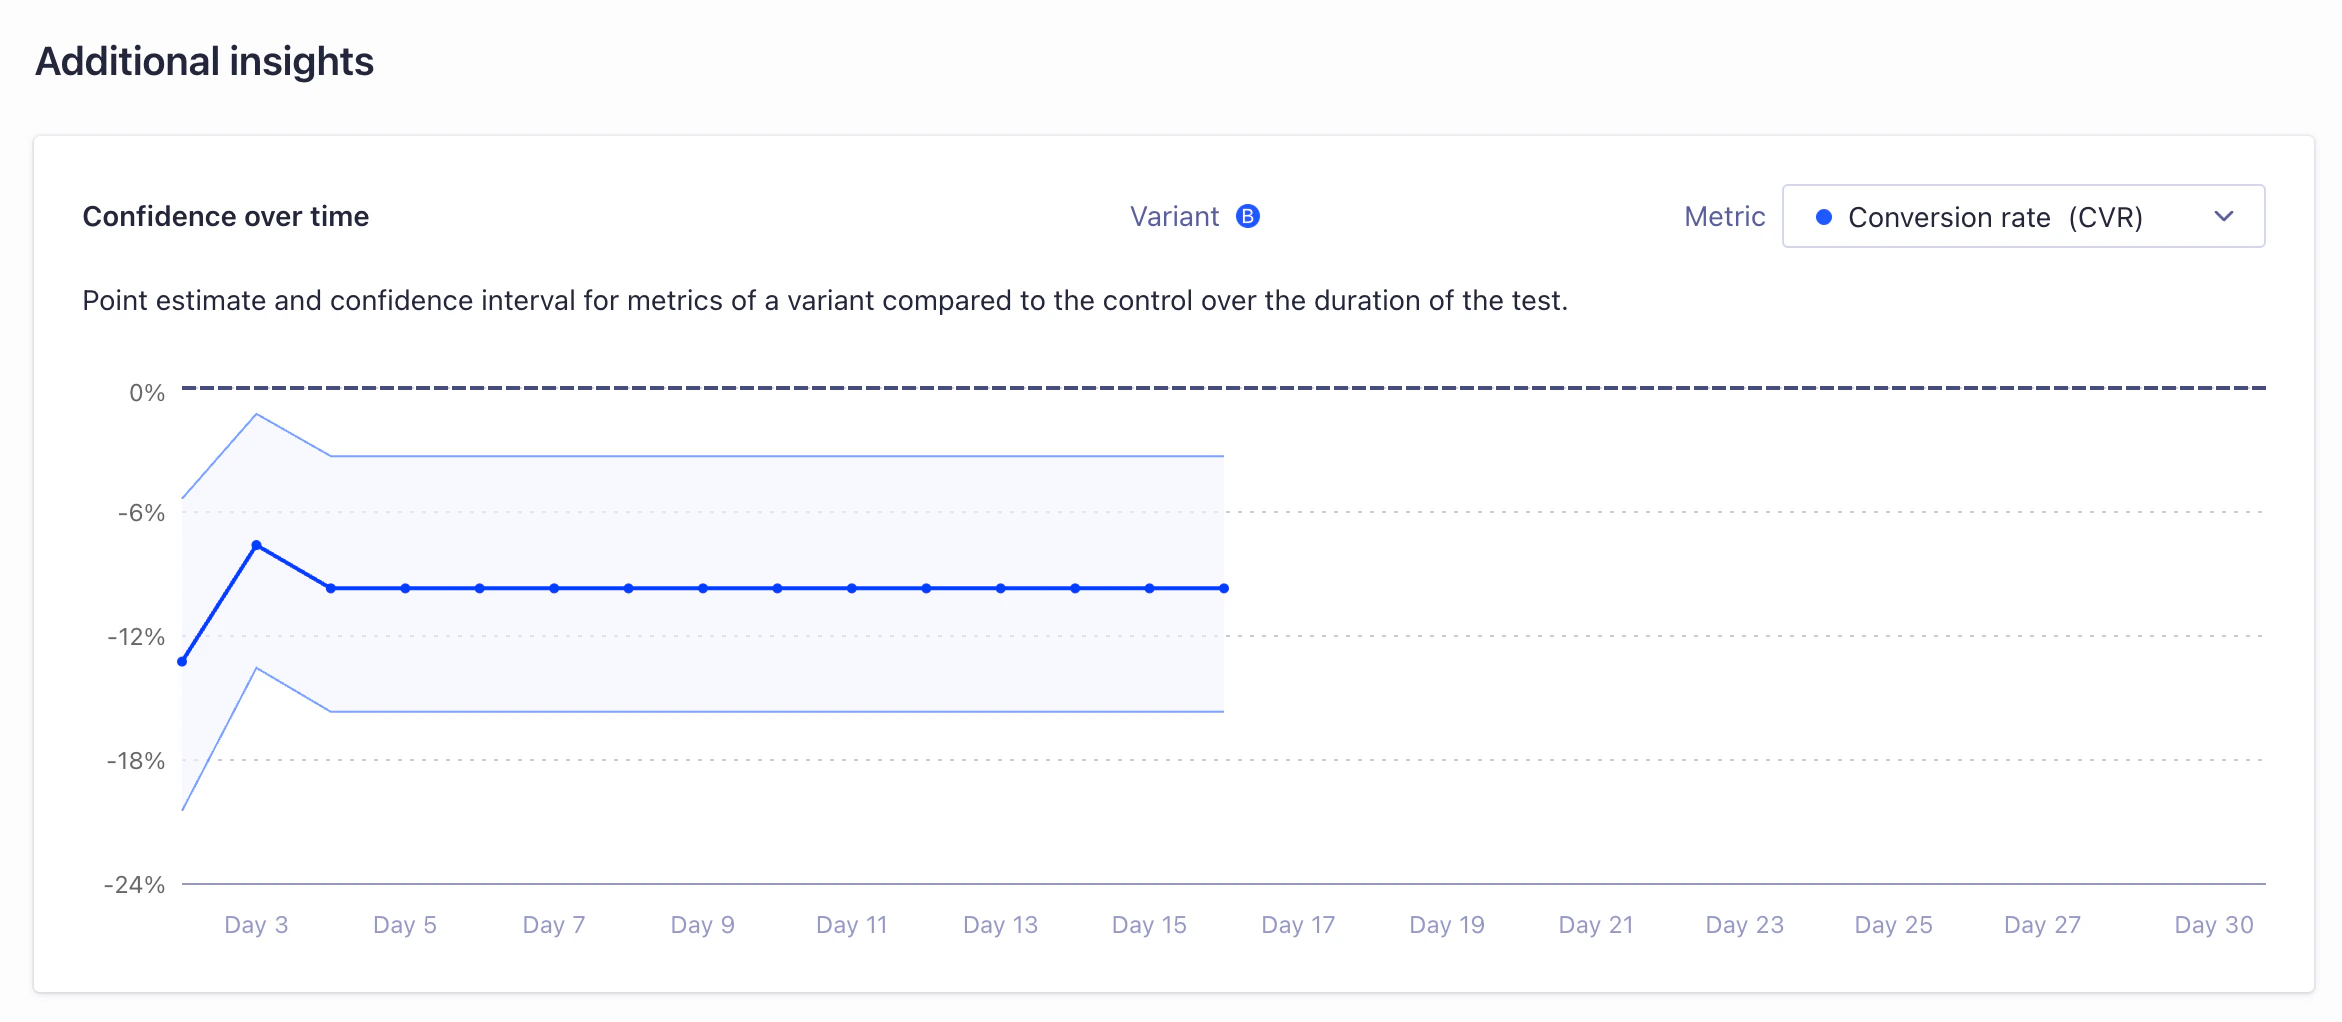
Basic test information appears in the dashboard within the first hour after you create a test.
Metric comparisons appear after 7 days or 20% of the test duration, whichever comes first.
This delay reduces the risk of drawing conclusions from insufficient data.
Algolia updates test results daily.
Test statuses
The potential test statuses are:- In progress - Not enough data: the test has started, and there is insufficient data to draw reliable conclusions. Hover over the badges to see data, but avoid drawing conclusions during this stage.
- In progress: the test is collecting data and comparing metrics.
- Failed: Algolia couldn’t create the test. Check the index and test configuration, then try creating the test again or contact Algolia support.
- Stopped: you stopped the test. Test traffic returns to the control. Algolia retains the test’s metadata and metrics, and the test remains visible in the dashboard. Its results might be inconclusive.
- Completed: the test has finished, and test traffic returns to the control.
How to interpret results
Compare the size of the improvement with the effort, cost, and risk of adopting the change. For example, a 4% relative increase in click-through rate or conversion rate might not justify restructuring your . A low implementation cost doesn’t make an uncertain result reliable. Consider the evidence, the expected benefit, and any negative effects on other important metrics before adopting a variant. For more information, see How A/B test scores are calculated.Confidence
A/B tests use either frequentist or Bayesian statistical methods. The confidence ratings in this section apply to frequentist tests and depend on the test status and p-value. A p-value is the probability of observing results at least as extreme as those measured, assuming no difference between variants and that the test’s statistical assumptions hold. It isn’t the probability that the result is a false positive, the false-positive rate, or the probability of reproducing the result. A small p-value provides evidence against the assumption that the variants perform the same. A large p-value doesn’t show that the variants perform the same. Frequentist tests use these confidence labels:- Not enough data to interpret: the test has started, and there is insufficient data to draw reliable conclusions on the performance of the variants. Hover over the badges to see data, but avoid drawing conclusions during this stage.
- No data: the test doesn’t have data to compare. Check that your app sends the events required for the selected metric.
- Unconfident: the available data doesn’t provide enough evidence for a difference. The rating can change as the test collects data.
- Trending confident: the data suggests a difference, but the test is still running. The rating can change.
- Inconclusive: the test has finished, but the confidence is too low to determine whether the observed change is due to chance. This might be because of insufficient data or high similarity between the variants.
- Confident: the test has finished, and the difference is statistically significant after any adjustment for multiple comparisons.
- A Confident decrease in conversion rate is evidence against adopting the change when your goal is to increase conversions.
- A Confident increase in conversion rate supports considering the change. Also assess its size, cost, and effect on other metrics.
- A Trending confident increase is preliminary. For a frequentist test, wait until the planned end before making a decision.
- An Inconclusive result doesn’t show whether the change has an effect. Consider a new test with a longer planned duration. More data can improve precision, but it doesn’t guarantee a conclusive result.
Collect enough data
Don’t base decisions on insufficient data or low confidence results. A small sample can make it hard to determine the effect. Use the statistical indicators for your selected method when assessing the results. For frequentist tests, follow the planned duration rather than stopping as soon as the result looks favorable.Recommendations
- Test before adopting a variant. After the A/B test finishes, test the configuration you plan to adopt with your search UI. Check that filtering works and that the configuration returns relevant results before applying it to all users.
- Keep index settings unchanged during a test. Changing settings makes the results harder to interpret. If you need to change settings, stop the test and create a new test with the updated configurations.
- Don’t use the same index for several A/B tests. You can’t use the same index in more than one test at the same time. You’ll get an error.
- Test search-time settings on one index. Select the Index configurations option and configure each variant with the settings you want to compare. The control and variants share the same index. No replica needed.
- Test one change per variant. Changing several features in one variant makes it harder to identify which change affected the results.
API clients
Use the Algolia dashboard for most A/B tests. Use an Algolia API client when you need to automate test management, for example:- Create similar tests for several websites that use separate indices.
- Start tests from your backend after data changes or in response to analytics. Monitor the results and be ready to revert changes that reduce important metrics.
- Create or delete A/B tests:
editSettings. - Retrieve A/B test results:
analytics.