We recently redesigned our analytics API from the ground up, in order to provide near real-time analytics to our customers on billions of search queries per day. Here’s how we did it.
Redsigning our Analytics system from the ground up
Our first analytics system started as a small side project. It consisted of batches of compressed log files being sent from all our search servers to a central storage service, before being pushed to an Elasticsearch cluster, from which we served the analytics queries.
Naturally, this system had its limitations. Firstly, we needed to pave the way for our new Click Analytics feature, where we wanted to leverage a more relational model. Doing so with Elasticsearch, where documents are independent, would have been too cumbersome.
Secondly, with dozens of billions of records to handle across many nodes, managing such cluster was becoming a full-time job.
Our search analytics provides our customers with insights about how their search is being used. These insights can easily grow in size. They range from overviews, like the number of searches or the number of unique users, to actionable business insights such as ‘What categories are users most interested in?’ or ‘Which queries return no results?’. All of these can also be done over specific time ranges which, in some instances, can be very very large.
What follows is an explanation of the tech choices we made when rebuilding our analytics from the ground up, as well as an overview of some of the design principles we put to use.
Choosing the datastore for Analytics
The top level requirements we needed to meet were:
- Handle ingestion, storage, and deletion of billions of events per day.
- Return results in sub-second for most queries, regardless of the time range being requested.
- Scale with us. We’re doubling our scale every year, so the selected solution should be able to keep up with that growth painlessly. Ideally by just adding more machines.
We started by evaluating powerhouses like RedShift, BigQuery and ClickHouse. While they are certainly good options for data warehousing, we did not find them good enough for real-time analytics workflow.
In our case, the focus is on performing sub-second analytics queries rather than long running analysis.
However, achieving sub-second aggregation performances on very large datasets is prohibitively expensive with RedShift, and not possible with BigQuery.
Additionally, another issue we found with BigQuery was that the pricing is driven by usage, not storage. As such, we didn’t consider it a safe choice to power a public API.
For ClickHouse, we were curious to try it out but ultimately found that there would be a lot of extra engineering overhead required to host, maintain and fine tune it.
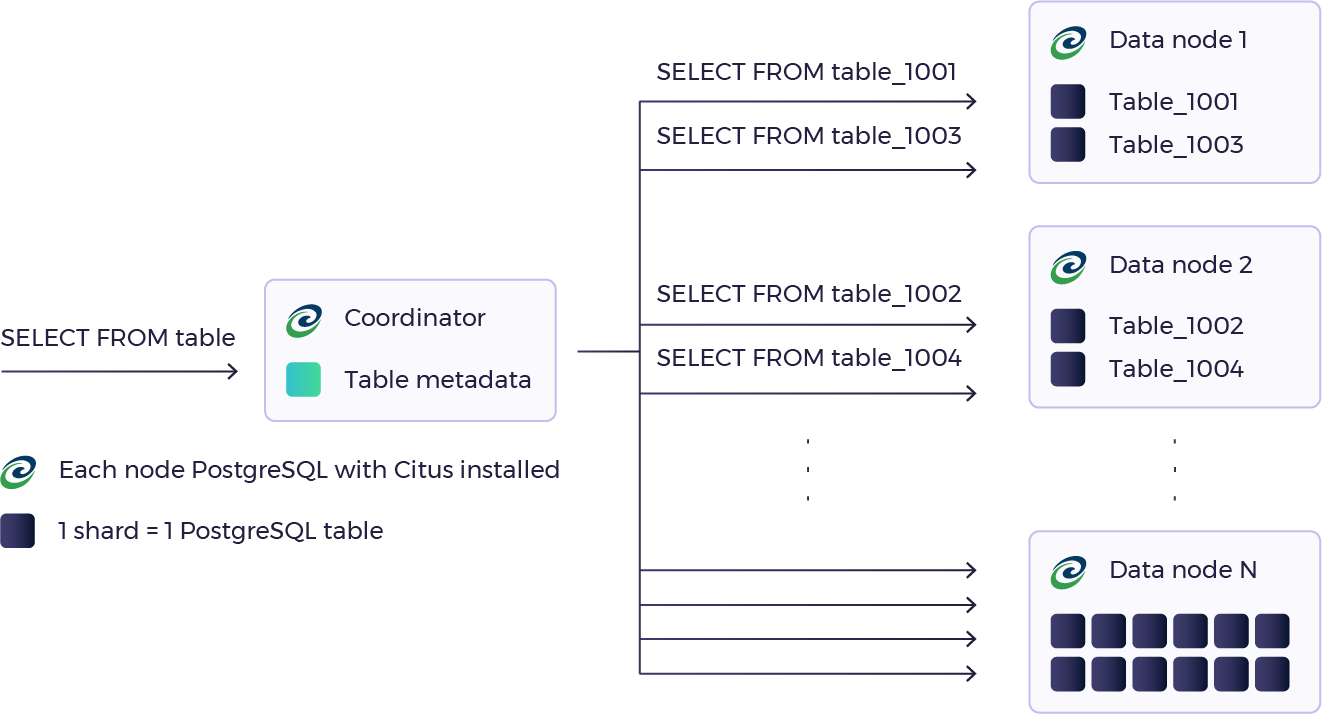
Finally, our search led us to Citus Data and their Citus extension for PostgreSQL, that makes it seamless to scale Postgres by distributing tables and queries across multiple nodes.
Citus Data also provides several extensions that are well suited to real-time analytics such as HLL (HyperLogLog) and TopN. The former is an algorithm for fast approximative distinct count, and the latter acts like a heap, which allows keeping top items sorted by frequency in a JSONB field.
If we opted for this solution, we could spread our customers’ data across many nodes, leverage collocation, and precompute metrics. As a bonus, we would still get the benefit of having a relational database running up-to-date Postgres instances.
With the data store decision made, here’s how the rest of our analytics solution works in practice.
Creating near real-time analytics
Achieving sub-second analytical queries doesn’t come out of the box though. We achieve this both by distributing data across shards and by using a roll-up approach.
To achieve this we have to perform the following steps:
- Ingest raw events into the system.
- Periodically aggregate events into dedicated rollup tables.
- Query the roll-up tables and get the result in milliseconds.
Ingestion
We take advantage of the Postgres COPY command to insert batch events into Citus. As we’ll see below, we never query the raw data directly so those tables can stay very simple schema-wise.
Without a lot of indices to update, the performance of insertion operations is quite impressive. Citus advertises ingestion of up to 7M rows per second (that’s 600B rows per day!) and our own benchmarks showed similar trends.
We distribute our data by customer. A single customer’s data lives on the same shard so we can take advantage of collocation. A request targeting a single customer app will only ever need to target a single Postgres instance.
Rollup
We don’t serve metrics from raw events. At some point, datasets, even for a single customer, can become too large to process on the fly if you’re looking for sub-second response time.
As a rule of thumb, you can expect to aggregate 1M rows per second per core with PostgreSQL.
We instead use roll-up tables. Rollup tables hold pre-computed metrics for a given time range.
As we’ve seen in the introduction, we often need to return tops and distinct count. This is made easy thanks to the TOPN and HLL extensions mentioned above.
Here’s a simplified rollup function that covers several use cases:
| |
CREATE OR REPLACE FUNCTION compute_5min_rollups(start_time TIMESTAMP, end_time TIMESTAMP) |
| |
RETURNS void LANGUAGE PLPGSQL AS $function$ |
| |
BEGIN |
| |
EXECUTE $$ |
| |
INSERT INTO rollups_5min |
| |
SELECT |
| |
date_trunc('seconds', (timestamp - TIMESTAMP 'epoch') / 300) * 300 + TIMESTAMP 'epoch' AS minute, |
| |
app_id, |
| |
timestamp, |
| |
count(*) AS query_count, |
| |
hll_add_agg(hll_hash_bigint(user_id)) AS user_count, |
| |
topn_add_agg(query) AS top_queries |
| |
FROM queries |
| |
WHERE timestamp >= $1 AND timestamp <= $2 |
| |
GROUP BY app_id, minute; $$ |
| |
USING start_time, end_time; |
| |
END; |
| |
$function$ |
view rawrollup.sql hosted with ❤ by GitHub
This function aggregates all queries received in a given time range into buckets of 5 minutes, and computes their count, the unique number of users (using HLL), and keeps the top queries, along with their respective count (using TOPN).
This function will be executed concurrently across all nodes.
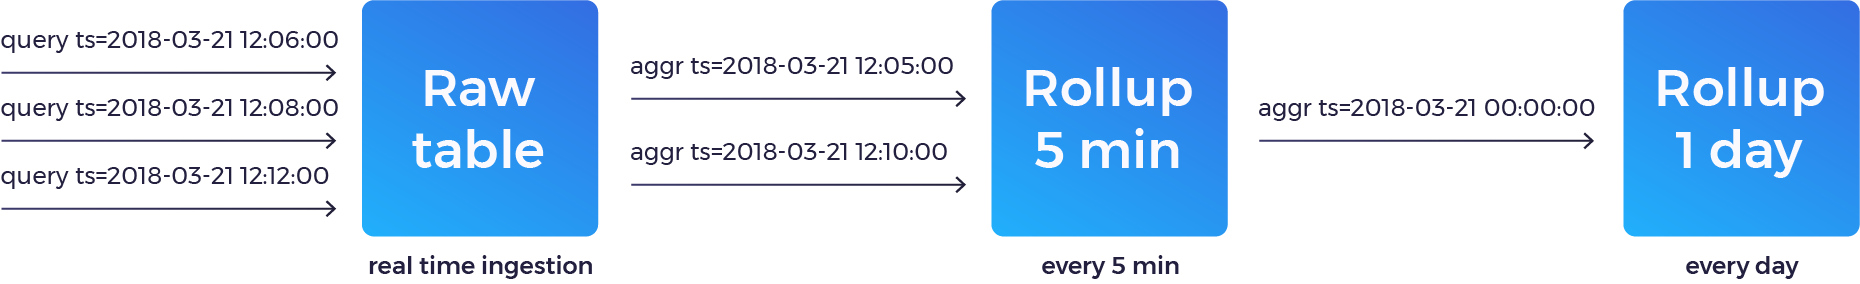
For our analytics solution we have several levels of rollups. We aggregate events every 5 minutes, and further aggregate them by day. We do this for several reasons:
- It means the metrics returned by the API are updated frequently. Roughly every 5 minutes, the data is refreshed, so customers don’t have to wait long until their queries are reflected in the dashboard.
- To compress our dataset even more, we keep daily aggregates. This means that at some point the granularity is reduced to the day level, but this is acceptable for us. We could even consider rolling our dataset by month after a point, which would allow us to keep offering close to unlimited retention, at the cost of coarser granularity. The opposite is also true, adding intermediate hourly rollup could also be an option in the future.
- Since we’re precomputing tops, we can’t incrementally append queries to them throughout the day. Doing so would yield very incorrect tops. Instead, we build many tops across the day, and we merge them all at once by EOD. We’re still doing a top of tops, but considering their fine granularity and the fact that we merge them all at once, in the end, we only saw a minimal difference compared to a more exhaustive (and much more computation intensive) approach.
A consequence of such an approach is that once the data is rolled up, we can delete it. We don’t need to keep terabytes of raw events in Citus to serve metrics and deleting data is made easy thanks to Citus’ ability to parallelize deletes across nodes.
Analytics Queries
The API targets the roll-up tables, never the raw tables. If we compare the number of rows from the raw tables and the roll-up tables, we see a compression ratio ranging from 50,000 to 150 on average (this of course varies based on the dimension picked for the aggregation).
This is what makes this approach work so well. Since ultimately our metrics are pre-computed per day, we can easily understand why we get results in milliseconds across virtually any time range: the amount of data to scan at query-time is trivial.
For instance, to get the count of queries for a given customer for the past week, it’s a quick index scan to fetch 7 rows living on the same instance followed by a sum.
To get the top 1000 searches for the past month, we fetch 30 rows, unnest the top items, and further aggregate them into our final top 1000.
Here are a few simplified example queries to demonstrate:
To get the count of queries:
| |
SELECT sum(query_count) |
| |
FROM (( |
| |
SELECT query_count |
| |
FROM rollups_5min |
| |
WHERE timestamp >= $1 AND timestamp < $2 AND app_id = $3 |
| |
) UNION ALL ( |
| |
SELECT query_count |
| |
FROM rollups_1day |
| |
WHERE timestamp >= $1 AND timestamp < $2 AND app_id = $3 |
| |
)) a... |
view rawquery-count-example.sql hosted with ❤ by GitHub
Since our metrics first live in the 5min rollup table before being merged into the daily roll-up, we query both tables and union their result at query time.
To get a distinct count of users, we take advantage of the HLL type which can compute the intersection of several HLL field.
SELECT hll_cardinality(sum(user_count))::bigint FROM ... WHERE ...
And last, but not least, here’s how fetching the top 10 queries would look:
SELECT (topn(topn_union_agg(top_queries), 10)).* FROM ... WHERE ...
All our analytics queries follow this pattern, where only a minimal aggregation logic is performed at query time.
The big picture
Let’s take a step back and have a look at the whole system:

Before actually inserting our queries into Citus, we first aggregate keystrokes into queries. Most of our customers have an InstantSearch implementation. With InstantSearch, results are obtained as you type. This is a great user experience that under the hood generates many API requests for a given search. For example, searching for ‘Algolia’ may result in up to 7 queries (A, Al, Alg… etc). When it comes to analytics, we only want to provide insights on full queries (someone searched for Algolia once), not the intermediate keystrokes.
To ensure this is the case, we have a pipeline that processes our logs to aggregate the sequence of keystrokes into searches, before pushing them straight into Citus.
We rebuilt this pipeline using Go as our language of choice. We’ve always had a microservice approach at Algolia, and over the past year we started building most our services (with the exception of our search engine) in Go and have been very satisfied so far, both in terms of performance and productivity.
To complete the picture, we rely on Kubernetes on GKE for orchestration, and Google Pub/Sub for communication across services.
Conclusion
Thanks to Citus and a roll-up based approach, our analytics handles billions of searches per day across thousands of customers, a number that is rapidly growing. So far, we’re very pleased by the performance and scalability of the system and are looking forward to building more products on top of it.
Check out how we’ve migrated our Citus on AWS to Citus on Azure without impacting our users or codebase.


%20(2).svg)