Named for the Friday following American Thanksgiving when retail accountants would change the color of their ink from red (losses) to black (profit), Black Friday is the biggest sales day of the year.
Black Friday is now a global sales event, during which even nations that don’t celebrate Thanksgiving offer shoppers deals, special perks, giveaways, and discounts. The Black Friday season can stretch for a weekend-long period extending from Black Friday to Cyber Monday, or even cover several weeks.
According to Adobe Analytics, US e-commerce sales rose 9.2% on Black Friday in 2025.
The concentrated surge in Black Friday online traffic causes more than a massive revenue boost. The onrush of high-intent customers tests the strength of your infrastructure, search, and UX. It gives you the opportunity to test multiple merchandising and pricing models before the critical Christmas buying season.
The data you collect over the Black Friday season is the key to evaluating the success of your sales efforts and provides you with comprehensive insight to drive sales and marketing strategies in the future.
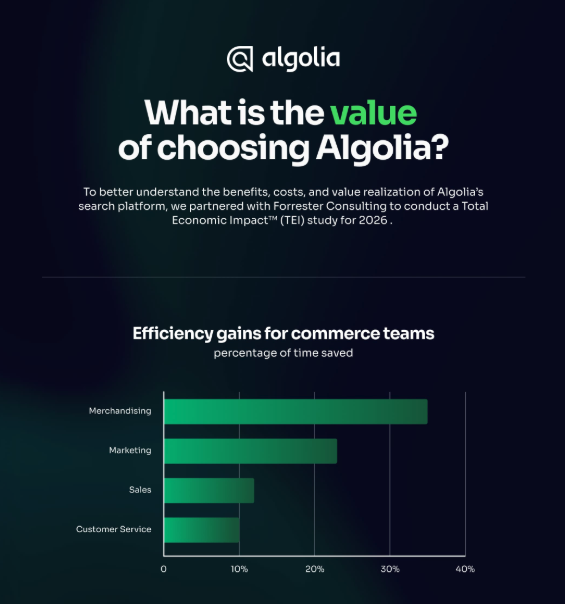
How Algolia fits into your strategy
A proven leader in Search and Product discovery, Algolia has all the tools you need to collect, understand, and make the most of your Black Friday sales data.
- Merchandising Studio: Our no-code interface combines drag-and-drop visual merchandising capabilities with powerful analytics for an all-in-one approach.
- AI Search and Retrieval: Our AI site search understands user intent so you can instantly surface the right content and deliver top-tier personalization.
- AI Personalization: Our AI learns each shopper’s affinities from events like clicks, searches, and purchases, and then dynamically re-ranks results in real time.
- Agent Studio: Our secure sandbox allows you to connect your chosen LLM to Algolia search and tools to create conversational bots, custom workflows, shopping assistants, and more.
- Algolia MCP (Model Context Protocol) Server: With our MCP,
AI assistants like ChatGPT and Claude can securely interact with your Algolia indices in natural language.
Harness the power of your merchandising data
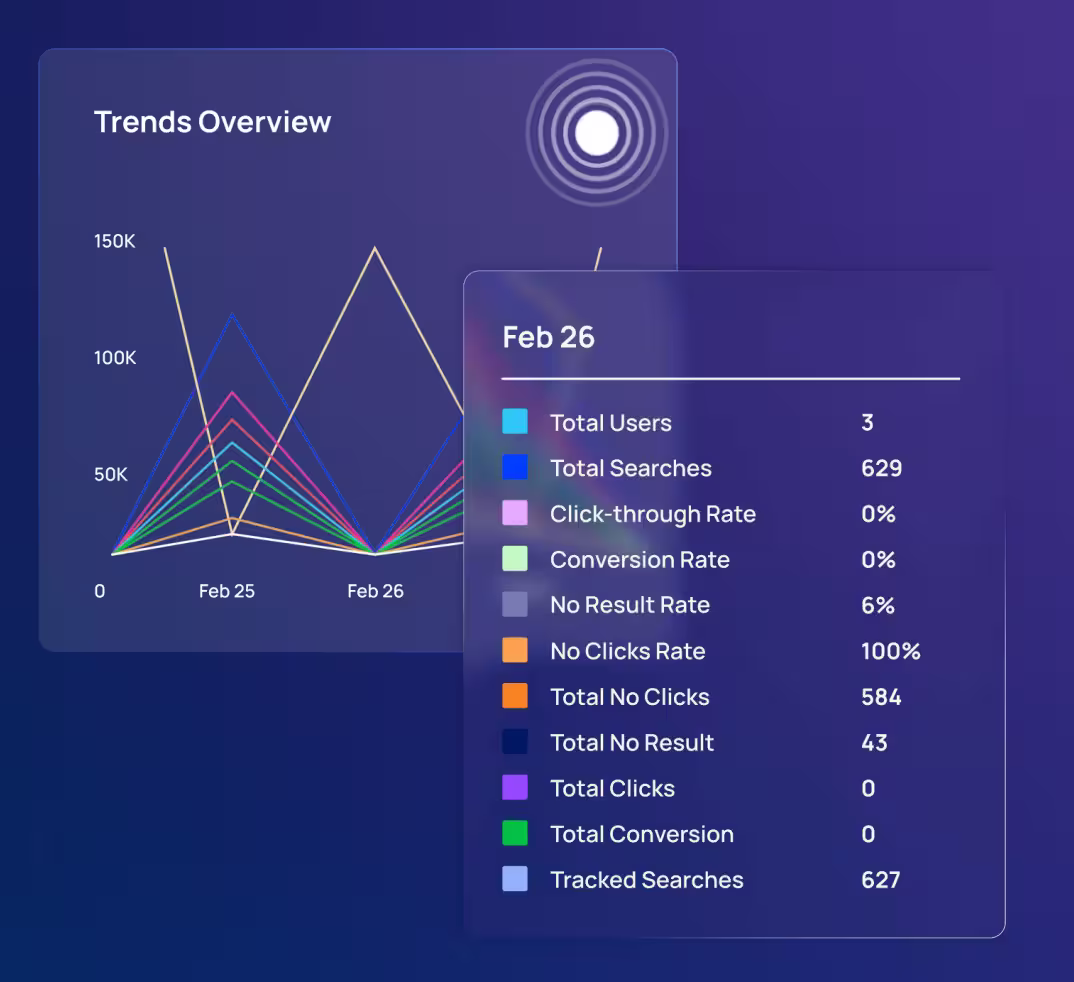
You can do more with your Black Friday sales data than just measure sales volume. You can use it to track core KPIs, identify and rank tactical successes and failures, locate gaps, analyze customer profiles, and monitor the overall customer experience.
Even better, you can turn regular measurement protocols into a data-driven playbook that builds your digital strategy in a profitable, reliable, and scalable way. To get the clearest view, here’s some of the data you should be collecting:
- Overall traffic and sessions on each channel
(e.g. web, mobile, app, etc.)
- Total orders and revenue
- Number of search and browse events
- Number of product views, cart events, and checkout steps
- Detailed infra metrics like latency, error rates, and uptime
You also want to track core ecommerce KPIs, such as:
- Conversion rate (CVR)
- Average order value (AOV)
- Revenue per session (RPS)
- Bounce rate
You also want segmentation tracking to understand customer patterns, including:
- Distinguishing between new and returning customers
- Tracking which campaign or channel source attracts the most customers
- Identifying what type of device and platform they use (e.g. desktop vs mobile)
Refine your search strategy
Some shoppers primarily use the search bar, others prefer browsing through product listing pages (PLPs). The surge of users on Black Friday gives you ample data to distinguish between ‘search’ and ‘browse’ behaviors, so that you can improve your overall search and retail strategies.
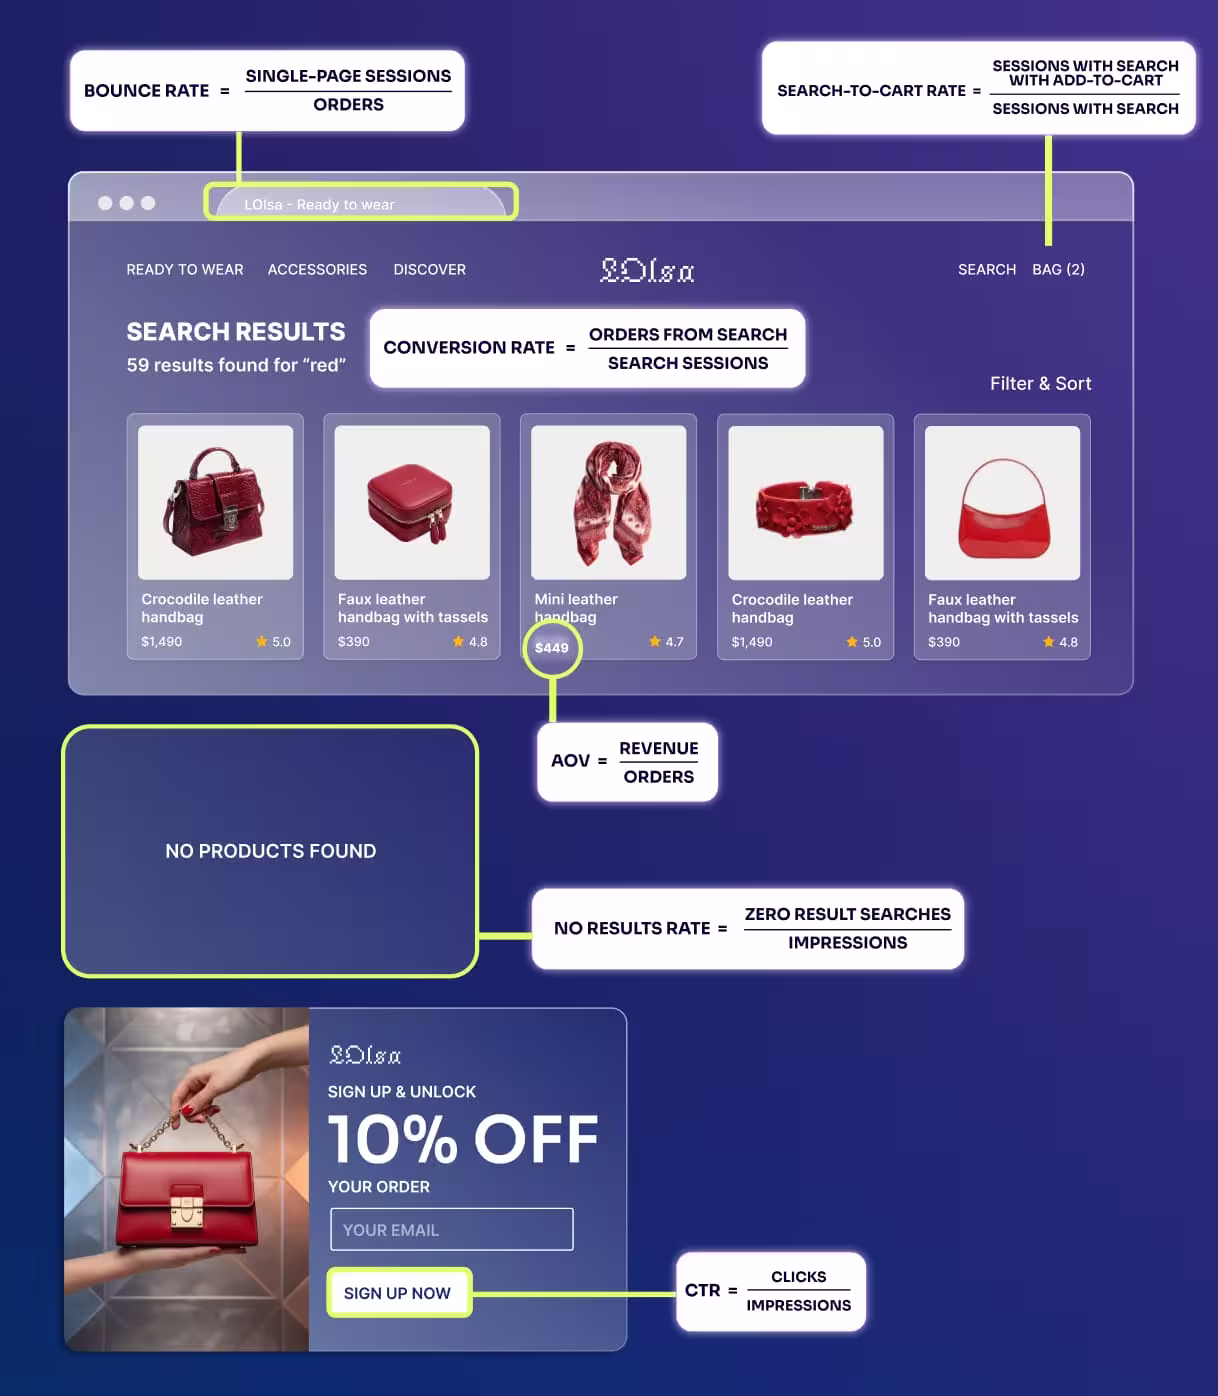
Once you’ve segmented the search group from the browse group, you’ll can map the following KPIs per segment:
- Conversion rate
- AOV
- Bounce rate
- Click through rate (CTR)
- No results rate
- Search-to-cart rate
Then you can turn your results into action. Start by drawing on the top converting queries to guide future promotional banners and navigation labels.
In campaigns or categories where the search group outnumbers the browse group, you can readjust your strategy to make search more prominent. Where the browse group outperforms the search group, you can strengthen your navigation for PLPs and use search logs to boost relevance.
Consider a fashion brand whose Black Friday data analysis demonstrates their search group converted at a higher rate than the browse group. They also note that high volume queries, like “party dress under $100,” had only mediocre conversion rates.
To improve sales during the all-important holiday season, the brand can make search more prominent, and curate landing pages for “party looks under $100”. They can also turn on search synonyms, so “New Year’s Eve dress” maps easily to “party dress”.
This can result in a significant improvement on those key high-volume queries in December, and higher AOV through items cross-sold on the PLPs.
Staying ahead of the surge
Slow search and/or checkout leads to abandoned carts even under normal circumstances. The urgency of the holidays increases users’ tendency to quit at the slightest hold up. Your IT infrastructure is a hidden but powerful revenue tool, and Black Friday is a load-bearing test.
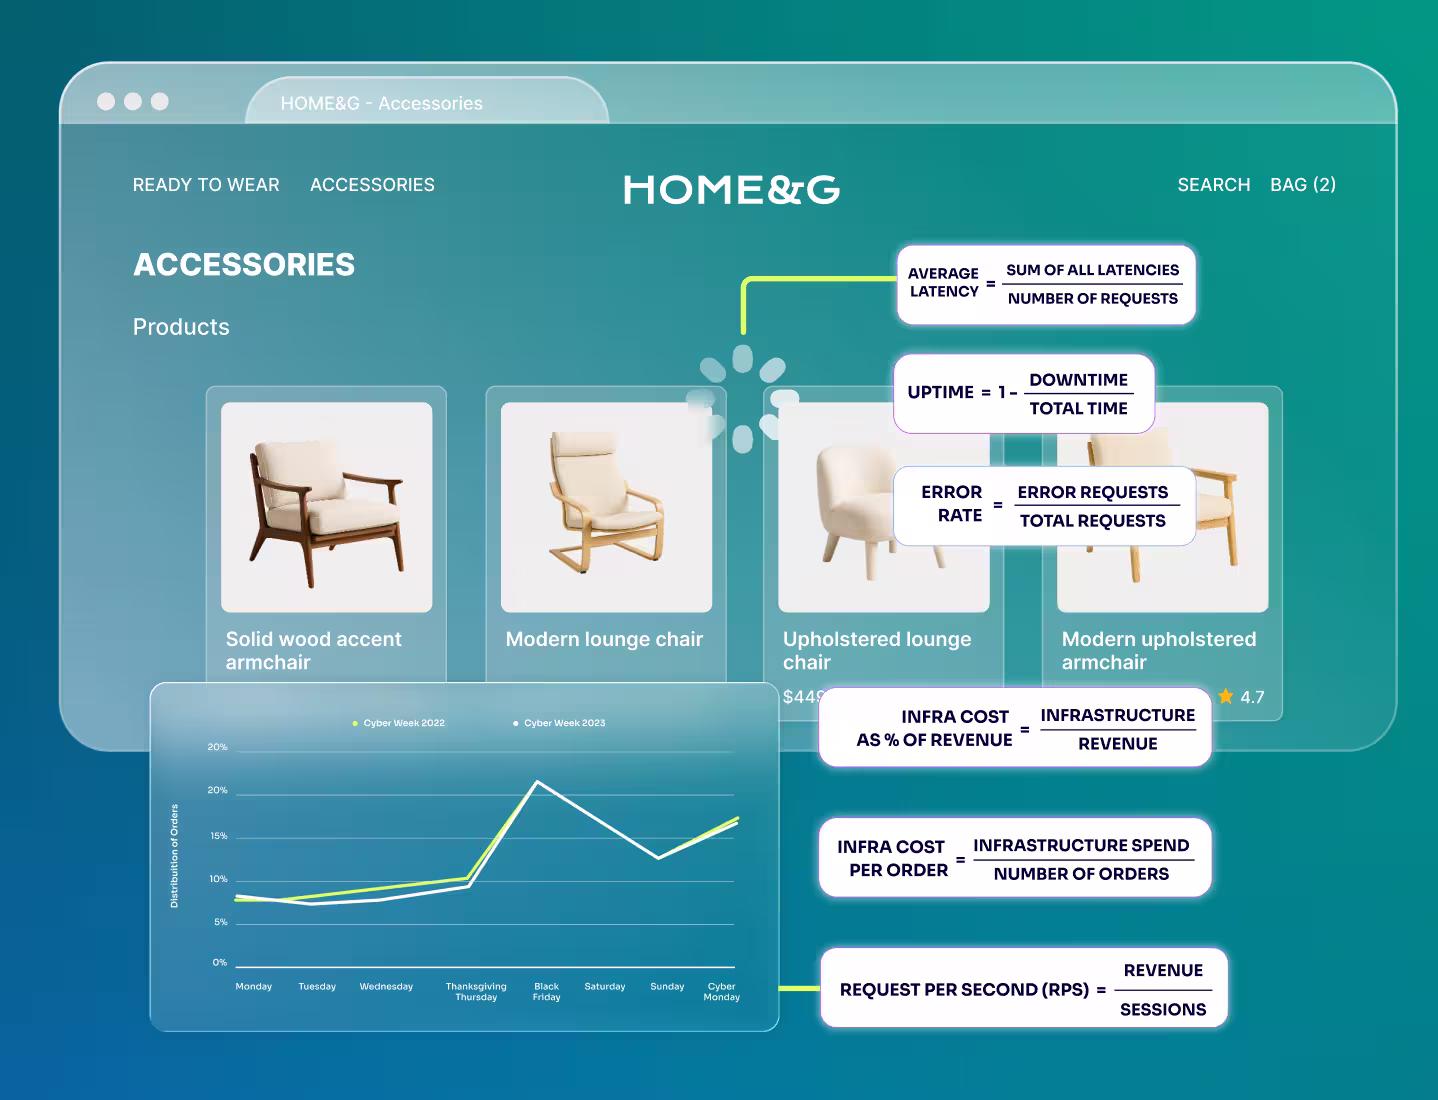
You can assess your performance and scalability with the following performance KPIs:
- Requests per second (RPS)
- Average latency
- Error rate
- Uptime
- Infra cost per order and infra cost as % of revenue.
Your Black Friday data provides a wealth of information about the security and reliability of your site under stress, not only assessing the performance of checkout and payment providers but also monitoring failed logins, bot traffic, and suspicious spikes in activity.
That data also gives you visibility into your computing cost, so you can determine if your architecture scaled without waste. Your data can produce auto scaling graphs allowing you to adjust your computing resources and power to where they’re most needed, as well as infra cost graphs to highlight the link between costs and levels of activity per unit.
A home goods retailer might find their product detail pages (PDPs) load well on Black Friday during the daytime but the latency in search API quadruples during the evening peak. Analyzing the data can show uncovered database contention such as traffic jams that develop when multiple searchers try to access the same database resources at the same time. The retailer might also discover their top search queries aren’t being properly cached.
Warned by their Black Friday data, the retailer can tune their queries, implement caching, and add read replicas, read-only copies of their primary database. This fixes bottlenecks before the Christmas season and delivers stable latency in higher peak traffic during the most important sales period of the year.
Warned by their Black Friday data, the retailer can tune their queries, implement caching, and add read replicas, read-only copies of their primary database. This fixes bottlenecks before the Christmas season and delivers stable latency in higher peak traffic during the most important sales period of the year.
Merchandising and channel effectiveness
Today’s customers discover your products in a variety of ways: directly on your site, via email, from paid search, social posts, or even through affiliates. Black Friday sales are an opportunity to connect your merchandising efforts to your sales channels. Using product-level performance, you can map which products sell best through which channel.
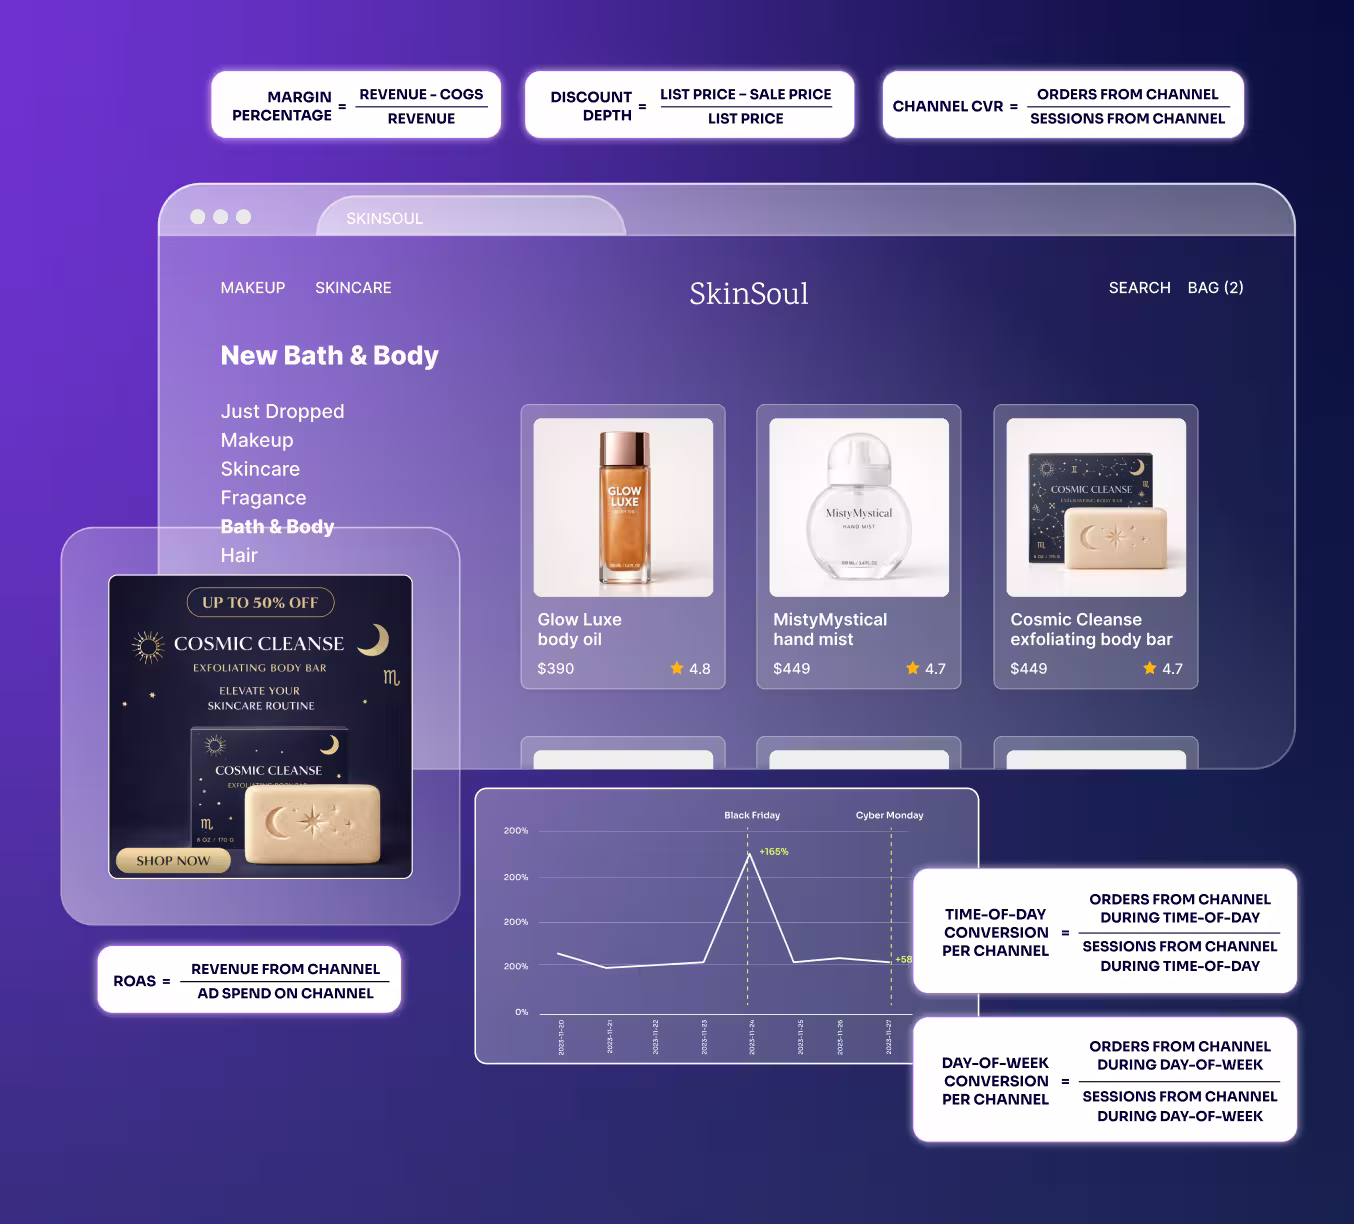
The key merchandising and sales channel KPIs to track include:
- Channel revenue, return on ad spend (ROAS), and contribution to overall sales
- Time-of-day and day-of-week conversion per channel
- Category-level margins vs discount depth
You can time your merchandising campaigns by identifying specific “power hours” on Black Friday and Cyber Monday, and translating them to holiday, weekly, or ongoing monthly patterns.
The Black Friday data for a beauty brand could reveal that email campaigns sent at 7 am and 8 pm had the highest conversion rates. Their paid social ads might have peaked late in the afternoon on Black Friday and the following Sunday.
Using those insights, the brand can remodel their upcoming campaign cadence for December. They can shift their ad budget to those specific, successful times and send fewer but more targeted email campaigns. Overall, the brand can realize a higher return per ad spend during the Christmas season.
Improve your website architecture and UX
How your website is structured shapes shopper behavior. The interplay between search, navigation, and filters influences what and how your customers buy. Breadcrumb trails, category hierarchy, and PLPs all play a role in leading shoppers to what they want. Your Black Friday sales data can single out which search tools worked best for you.
The behavioral and UX KPIs to monitor include:
- Time to first product view
- Pages per session
- Path length to purchase
- Product detail page (PDP) view-to-cart rate and view-to-purchase rate
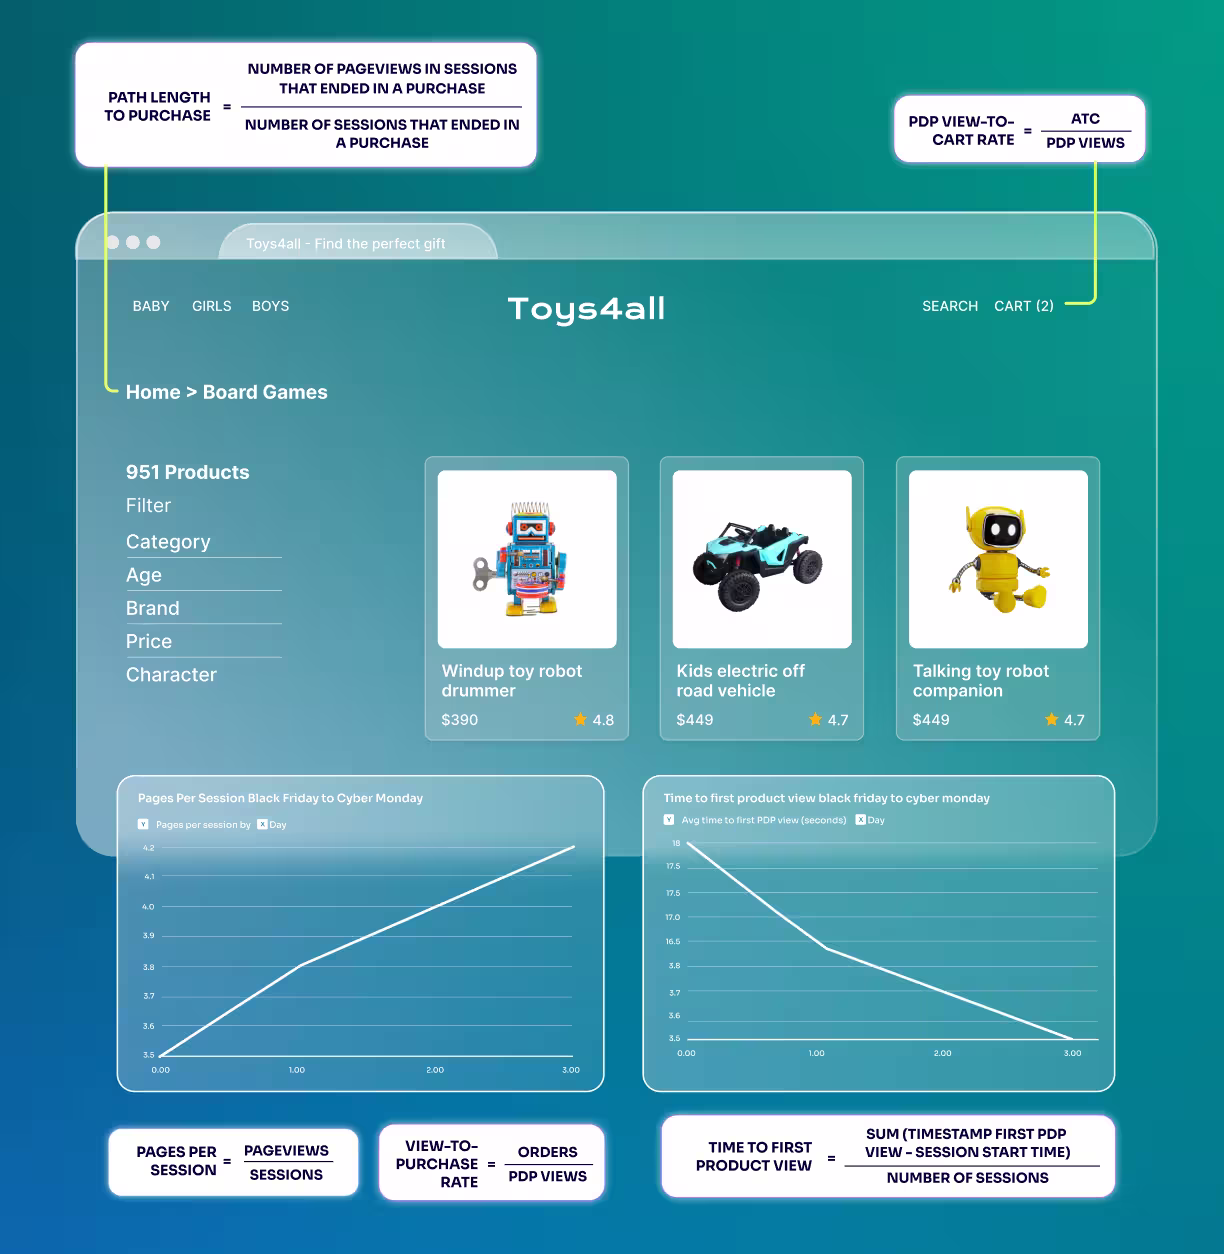
By mapping customer journeys from original landing page to checkout, you can use your Black Friday data to effectively rebuild your information architecture by identifying categories with high traffic but low conversion. You can also detect and locate “orphan” products – those with high search volume but low discoverability.
The Black Friday sales data of a toy retailer might reveal a major disconnect with their site structure: their navigation is organized by brand, but their customers often search based on age. Instead of looking for specific toys, customers use search terms like “gifts for 6-year-olds”. To shorten users’ path to purchase, the retailer can introduce age-based primary navigation and filters. They also can create gift guides and seasonal PLPs for categories like “STEM toys”, “family games”, and more.
During December, the customers’ path to purchase will be noticeably shortened, and conversion for queries including the word ‘gift’ will increase dramatically.
Optimize and forecast inventory
Your Black Friday sales data highlights your bestsellers just before the Christmas rush. Using purchases, product views, and add-to-cart transactions, you can identify which products are your everyday heroes, surprise sellers, or underperformers before December. That puts you in a position to optimize both your inventory and your product placement.
To maximize sales and minimize inventory overstock, you’ll want to watch product-level KPIs such as:
- View-to-purchase rate
- Add-to-cart rate
- Sell-through rate
- Stockout rate (days out of stock)
The ability to highlight bestsellers and deprioritize traffic sponges lets you plan your inventory based on holiday peaks, identify over- or under-provisioning, and prevent panic scaling.
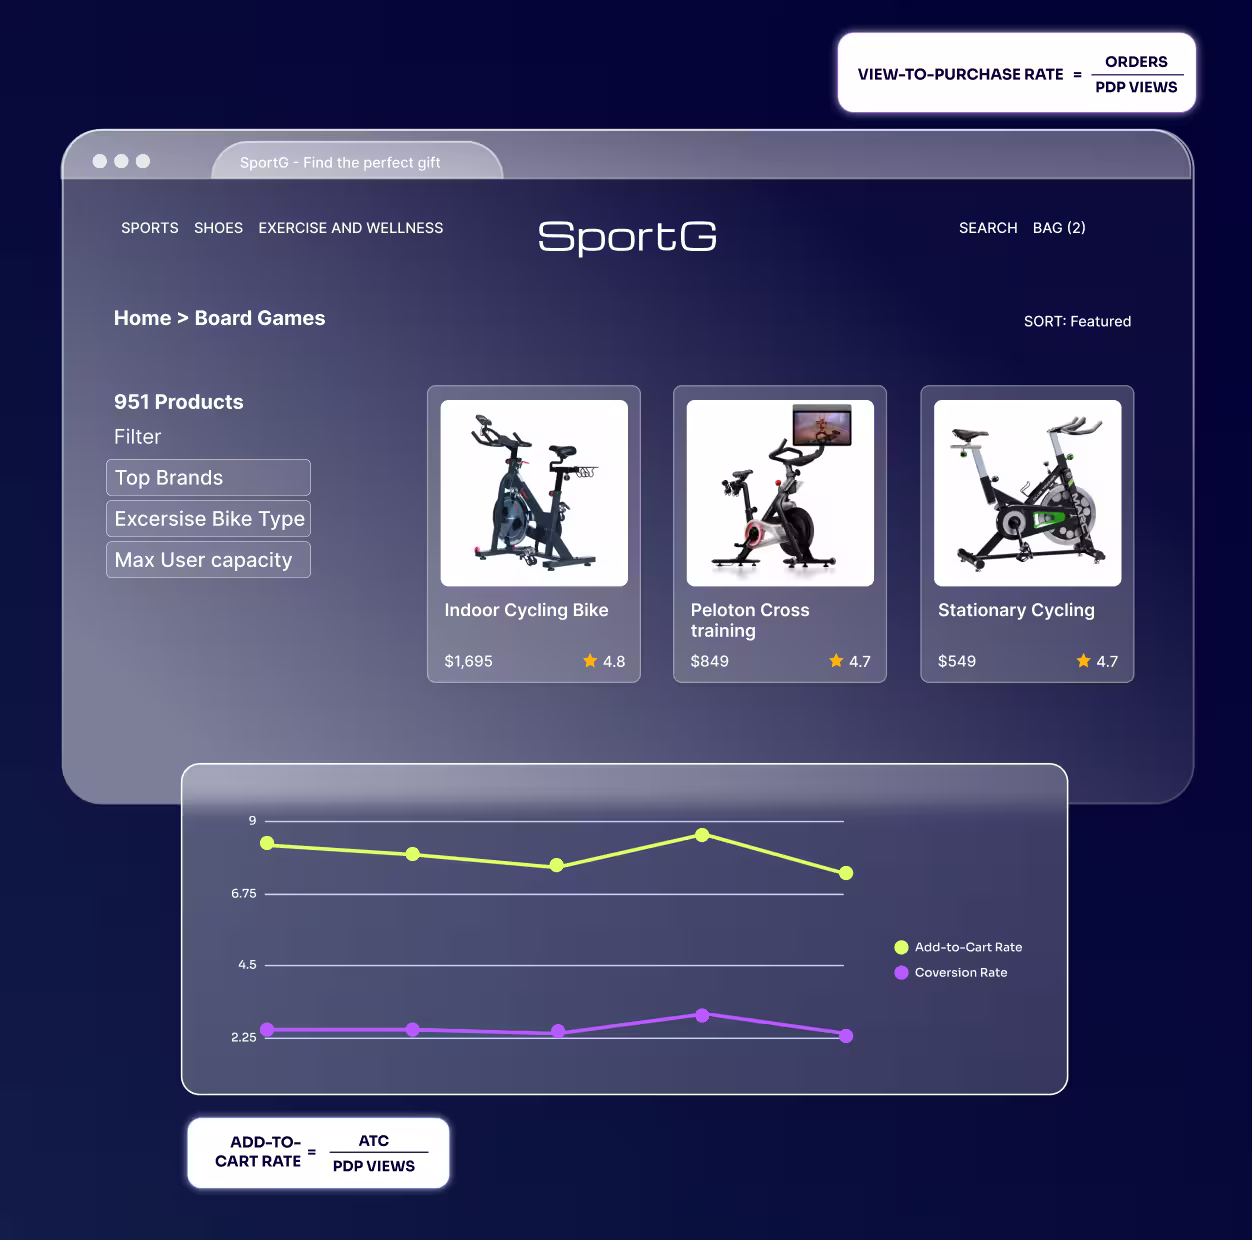
You can flag and reorder products that sold out fast, while distinguishing them from products that required deep discounts to move. And though each holiday season is different, you can begin to forecast for next season’s ordering.
You can also adjust product placement to further feature high-conversion products on your home page and PLP, continuing to build on Black Friday successes throughout the rest of the holiday season.
A sportsgear retailer could use their Black Friday data findings to plan their inventory for the upcoming year. They might find a new line of exercise bikes sold out in a few days, while similar but older SKUs barely moved.
To capitalize on the sales trend, they can double their order of high-performing exercise bikes and feature them prominently in their January “New Year fitness” campaign. The retailer might also add a deep discount to the non-performing SKUs to move them in a clearance sale. As a result, they can reduce their leftover inventory while staying well-stocked with the most popular January item.
Build smart pricing and promotion strategies
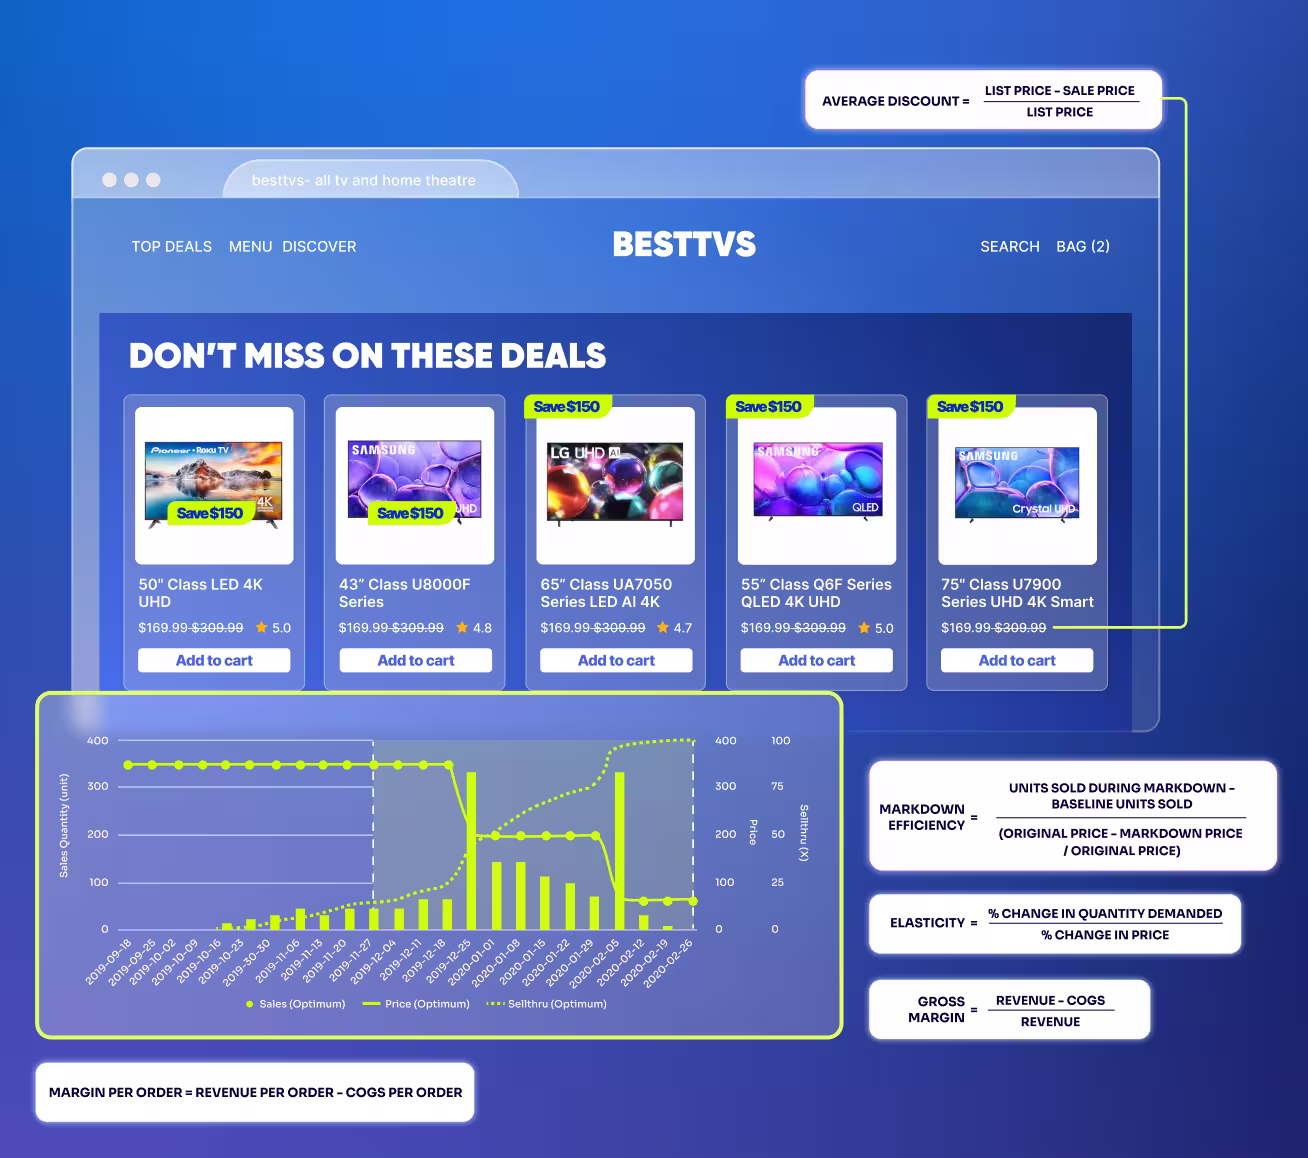
More discounts don’t necessarily equate to higher profits. Your Black Friday data can help you test price elasticity and understand how your discounts actually perform in high-stakes situations.
The crucial pricing KPIs to watch include:
- Gross margin and margin per order
- Average discount
- Markdown efficiency (the incremental volume per discount point)
- Simple price elasticity estimates
The massive sales surge of Black Friday is the perfect chance to test your promotional mechanics. You can try both fixed discounts and percentage discounts to see which model gets more traction. Another testable concept is a site-wide threshold promotion, such as “Spend $100, get 10% off.” You can also create savings bundles, whether in the form of BOGOs, gift sets, or starter packs.
An electronics retailer can test discounts during their Black Friday campaign by putting a “20% off everything” fixed discount against a “Spend $250, get $50 off” threshold discount across multiple platforms and audiences.
Their Black Friday sales data will prove which discount offer drove higher total conversion and higher AOV, regardless of channel. The retailer can carry that insight forward into their post-holiday clearance season, moving more inventory and increasing overall sales.
Capitalize on Emerging trends
Spotting emerging seasonal trends is a key priority for retailers. Your Black Friday sales data gives you early warning for both the holiday season and the months beyond. The revealed growth and share-of category rates are trend indicators for the year to come.
Trend KPIs to watch include:
- Attach rate for key accessories or add-ons
- AOV uplift from recommendations
- Revenue share influenced by recommendations
You can also use Black Friday baskets as an opportunity to cross- and upsell, creating and attaching “Frequently bought together” tags, and building recommendation rules. Those rules can even be personalized by segment. Deal hunters, for instance, who primarily purchase items with high discounts, should receive different recommendations than category loyalists who primarily purchase within their preferred category.
An adventure gear retailer might find in their Black Friday data a strong pattern of tents, sleeping bags, and portable stoves being bought together. For the December gift season and January sales, the retailer can set PDPs to display “Complete your camping kit” recommendation blocks. They also can send personalized emails to tent buyers, suggesting moderately discounted sleeping bags and stoves.
A ‘complete the kit’ campaign can substantially increase AOV during the rest of the holiday season and significantly boost the attach rate for add-ons.
Reduce cart abandonment and build retention
The pressure and urgency of the holiday season amplifies any friction in the online shopping experience. Complicated checkout processes, payment issues, unexpected fees, shipping costs: all of these frustrate customers into abandoning their carts. But your Black Friday data can help you locate specific problem areas so you can reduce or eliminate that friction.
Top abandonment KPIs to monitor include:
- Cart abandonment rate
- Checkout step drop-off rates (e.g. whether it happens at shipping, payment, review, etc.)
- Device-specific abandonment (e.g. mobile vs desktop)
The insights you derive from your Black Friday sales data can improve your checkout not only through Christmas but also year-round. If the payment step caused a spike in drop-offs, you can add more payment options. If there’s a notable difference between devices, simplify the UX on the underperforming device.
A gourmet wine and food brand’s Black Friday data might reveal a big spike in abandonment on their mobile channel when shipping fees appeared. To fix the problem, they can simplify checkout flow for mobile users, prefilling information where possible. They might also post a prominent “Free Shipping over $75” banner. Then the retailer can send targeted emails to Black Friday mobile buyers with exclusive early access to sales events in January.
A simplified checkout process and clearly posted shipping banner can improve checkout completion on mobile throughout the rest of December. The targeted emails can re-energize mobile customers and lead to a repeat purchases increase in January.
Turn insights into a data-driven playbook
Black Friday sales are massive, but they have implications beyond a single day or weekend. Several of the examples above used their Black Friday data to forestall friction and boost sales in the lead-up to Christmas and through the winter sale season. But the insights you extract from your Black Friday sales data can go even further and become part of your standard practice.
You can turn your Black Friday reporting into a template for the future, assigning data sources and metrics to different areas, including search, UX, infra, merchandising, etc. And you can use those templates to design experiments, such as:
- A/B tests on pricing, search ranking, and layouts
- Feature rollouts like new filters, recommendation blocks, payment options
- And more
Nor are you limited to using your Black Friday data only to plan for big peaks. You also can use it as a roadmap for the coming year. For instance, you can use Q1 to fix any checkout or infra issues exposed by holiday traffic.
When operational issues have been addressed, you can use Q2 and Q3 to experiment with sales and marketing campaigns, testing discounts and recommendations, by both channel and segment. Each mini campaign can be refined as you proceed through the year.
You’ll enter Q4 armed with a tested and true understanding of your customer base, and meet your next Black Friday with clear KPIs, a solid plan, and a well-tuned system.
Build a culture of data-led holiday planning
When it comes to sales success, thorough data analysis is essential. And your Black Friday sales data contains a wealth of information you can use to fine-tune your sales strategies both through the holiday season and throughout the rest of the year.
Using the insights gleaned from your Black Friday sales, you can instill a culture of ongoing measurement, and encourage cross-team collaboration between your marketing, product, merchandising, and IT departments. After all, it takes the whole team to thrive through the busiest shopping period of the year.
Find out how Algolia can help you prepare for your next Black Friday season.


%20(2).svg)
